Figure 2.
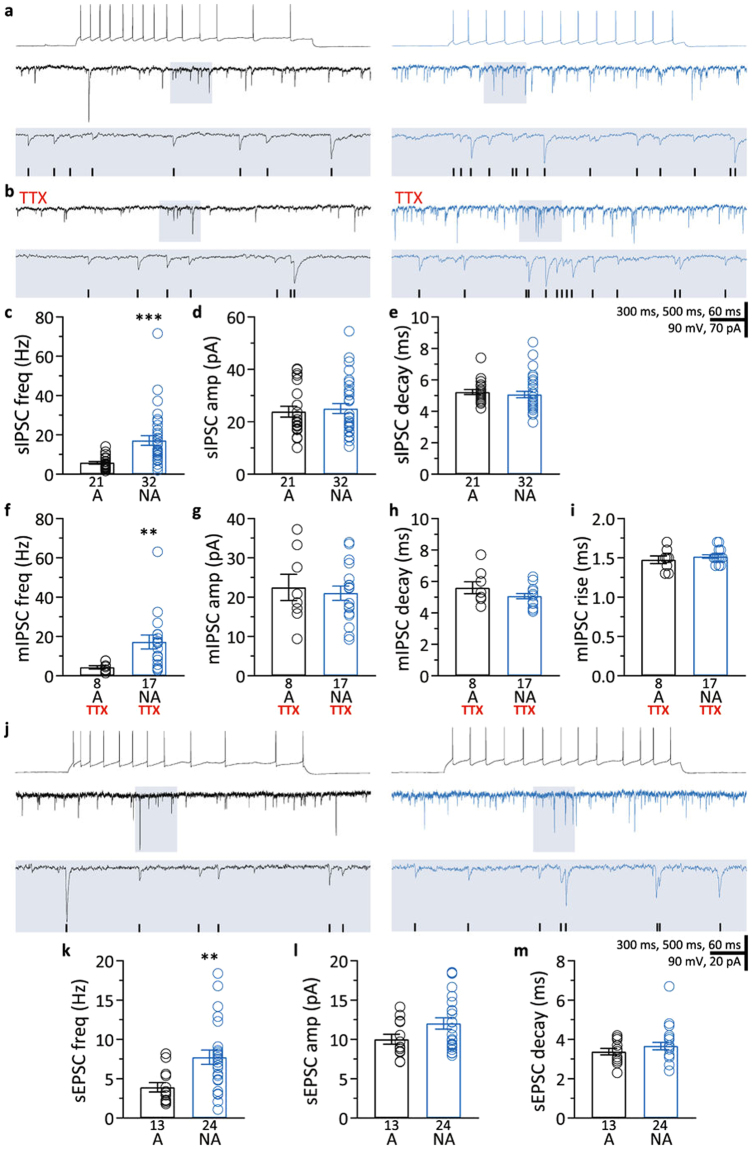
Characterization of synaptic inputs in adapting and non-adapting L5 pyramidal neurons. (a) Representative recordings illustrating lower sIPSC frequencies in an adapting neuron (left) than in a non-adapting neuron (right). Top traces, action potentials fired in response to intracellular current injection. Each middle trace shows a representative voltage-clamp recording of sIPSCs made from the neuron whose spiking is shown above. Lower traces are expansions of the shaded areas in the middle traces. Detected events are marked with black ticks in the shaded area. (b) Representative recordings showing lower mIPSC frequencies in the adapting neuron (left) than in the non-adapting neuron (right). Recordings are from the same neurons shown in (a). Lower traces are expansions of the shaded areas in the traces above. Black ticks represent detected events. mIPSCs were recorded while action potentials were blocked with 1 µM TTX. (c–e) Summary of sIPSC frequency (c), amplitude (d), and decay time (e) of sIPSCs recorded in adapting (A) and non-adapting (NA) neurons. (f–i) Summary of mIPSC frequency (f), amplitude (g), decay time (h), and rise time (i) of mIPSC recorded in adapting (A) and non-adapting (NA) neurons while action potentials were blocked with TTX. (j) Representative recordings illustrating lower sEPSC frequencies in an adapting neuron (left) than in a non-adapting neuron (right). Top traces, action potentials fired in response to intracellular current injection. Each middle trace shows a representative voltage-clamp recording of sEPSCs made from the neuron whose spiking is shown above. Lower traces are expansions of the shaded areas in the middle traces. Black ticks represent detected events. (k–m) Summary of sEPSC frequency (k), amplitude (l), and decay time (m) of sEPSCs recorded in adapting (A) and non-adapting (NA) neurons. Data presented as mean ± standard error. **p < 0.01; ***p < 0.001.

