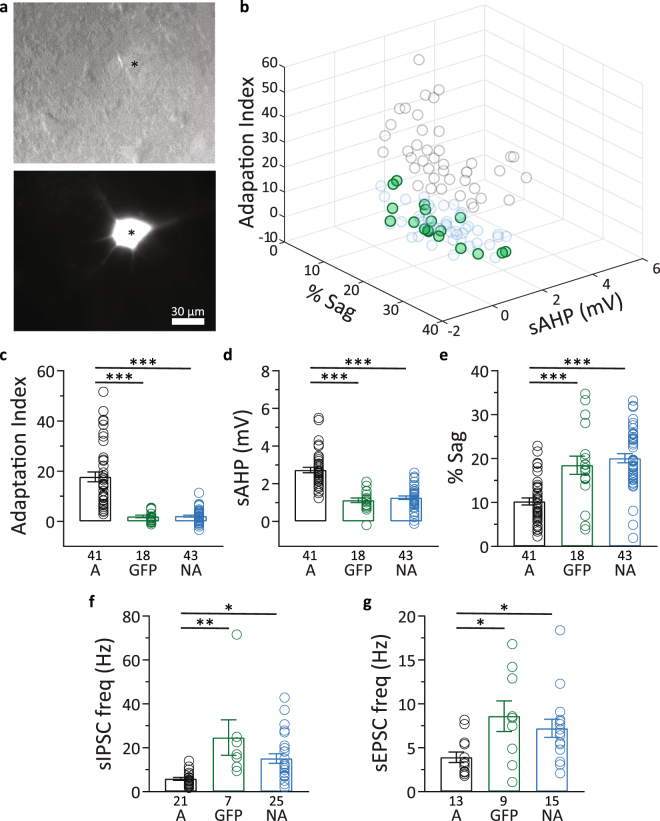
Figure 3.
Intrinsic properties, sIPSCs, and sEPSCs in thy1-GFP+ neurons. (a) Top, representative example of a L5 pyramidal neuron in S1BF under Dodt gradient contrast (*). Bottom, epifluorescence image of the same field of view showing the “*”denoted neuron is GFP+. (b) 3D scatter plot of adapting and non-adapting pyramidal neurons as in Fig. 1b, highlighting the thy-1 GFP+ neurons (green circles) included in the cluster analysis. (c–e) Summary of data showing that GFP+ cells (GFP) and GFP− cells from the non-adapting group (NA) did not differ from each other in adaptation index (c), sAHP (d), and sag (e) but both of these cell groups had different sAHP, sag, and adaptation index compared to adapting L5 pyramidal neurons (A). (f) Summary of data showing that GFP+ cells (GFP) and GFP− cells from the non-adapting group (NA) did not differ in sIPSC frequency, but both had higher sIPSC frequencies compared to adapting L5 pyramidal neurons (A). (g) Summary of data showing that GFP+ cells (GFP) and GFP− cells from the non-adapting group (NA) did not differ in sEPSC frequency, but both had higher sEPSC frequencies compared to adapting L5 pyramidal neurons (A). None of the adapting cells in this study were GFP+. Data presented as mean ± standard error. *p < 0.05; **p < 0.01; ***p < 0.001.

