
Figure 3.
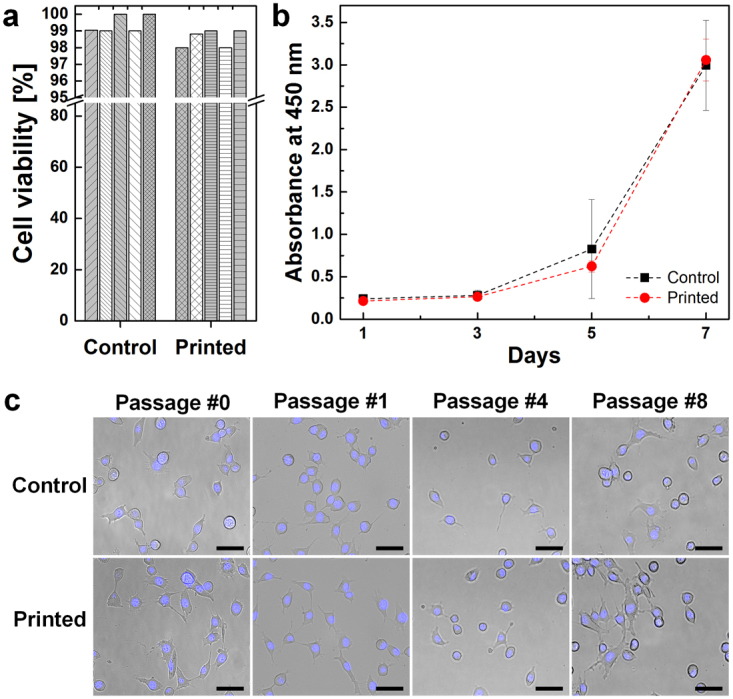
Post-printing cell viability tests. (a) The LIVE/DEAD assay was used to measure cell survival immediately after printing. Each bar indicates an individual assay (n = 5). (b) The proliferation rate was measured every other day for 7 days. No significant differences were observed using the two-way ANOVA followed by Tukey’s post hoc test, p > 0.05; error bars indicate the s.d. (n = 5). (c) Long-term cell morphology was monitored until passage 8. Cells from both the printed and control groups maintained their original morphologies. Nuclei were stained with Hoechst 33342 dye. Scale bar: 50 μm.