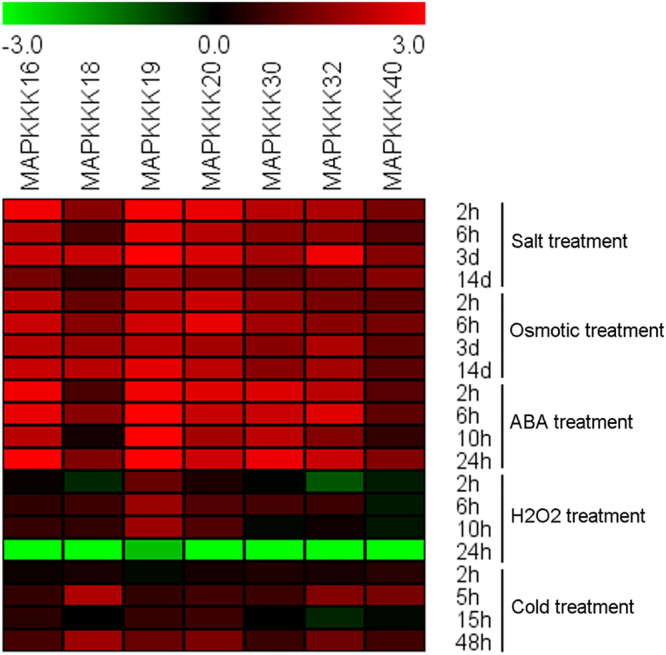
Figure 8.

Expression of cassava selected MeMAPKKKs in response to various stimuli. The heatmap was constructed using Log2 based fold change from three biological replicates of qRT-PCR data. The scale represents the relative signal intensity.

Expression of cassava selected MeMAPKKKs in response to various stimuli. The heatmap was constructed using Log2 based fold change from three biological replicates of qRT-PCR data. The scale represents the relative signal intensity.