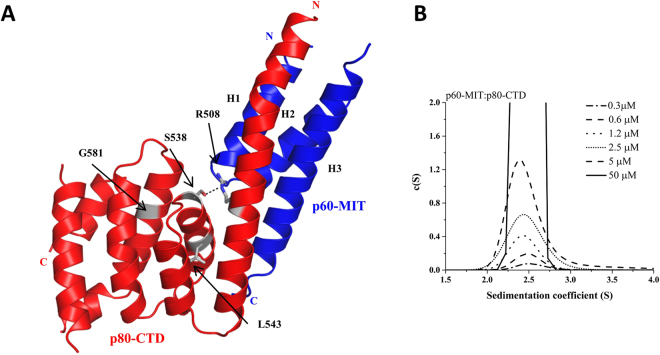
Figure 1.
Biophysical and structural characterization of the p60-MIT:p80-CTD complex by AUC and X-ray crystallography. (A) Cartoon representation of the crystal structure of the p60-MIT L40P:p80-CTD complex. Blue, p60-MIT; red, p80-CTD. Microcephaly-associated mutations S538L, L543R and G581D, are highlighted as grey sticks. The intradomain hydrogen bond formed between S538 and R508 is indicated by a black dotted line. (B) c(S) distribution analysis of the p60-MIT:p80-CTD complex.

