
Figure 1.
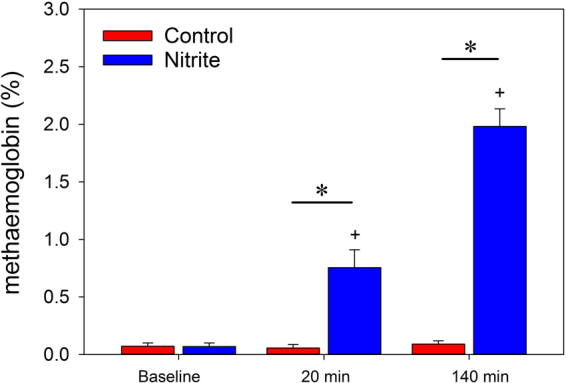
Methaemoglobin at baseline, after 20 min, and after 140 min of continuous nitrite or saline infusion. Data are mean ± SEM, n = 9 for the saline group (control), n = 11 for the nitrite group, *denotes p < 0.05 control vs. nitrite group, + denotes p < 0.05 vs. baseline in the nitrite group. Both groups were exposed to a brief hypoxic challenge and to unilateral ischemia-reperfusion between the blood sampling at 20 min and that at 140 min.