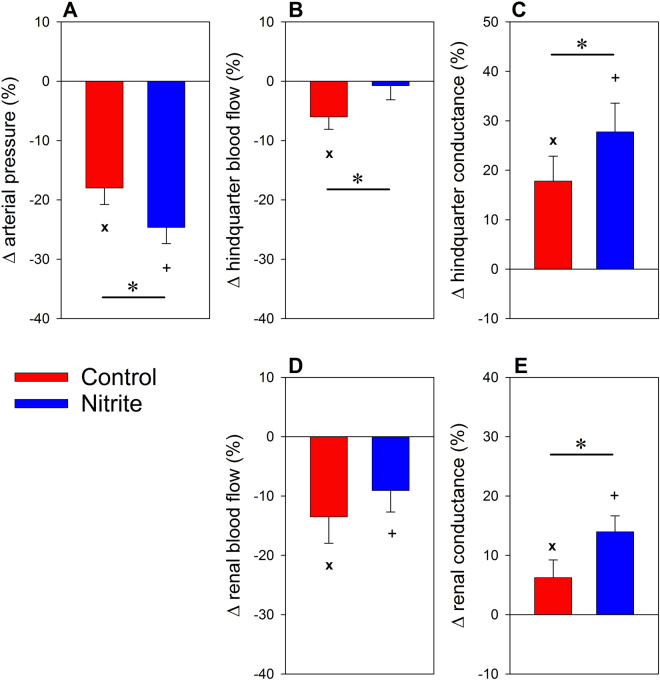
Figure 2.
Response of arterial pressure (panel A), hindquarter blood flow (B), hindquarter vascular conductance (C), total renal blood flow (D), and renal vascular conductance (E) to a brief hypoxic challenge (inspiratory fraction of oxygen 10%). Data are percentage changes at the end of 100 s of hypoxia as related to the values recorded immediately before commencement of the hypoxia intervention (mean ± SEM, n = 9 for the saline group [control], n = 11 for the nitrite group); *denotes p < 0.05 control vs. nitrite group, x denotes p < 0.05 normoxia vs. hypoxia in the control group, +denotes p < 0.05 normoxia vs. hypoxia in the nitrite group.

