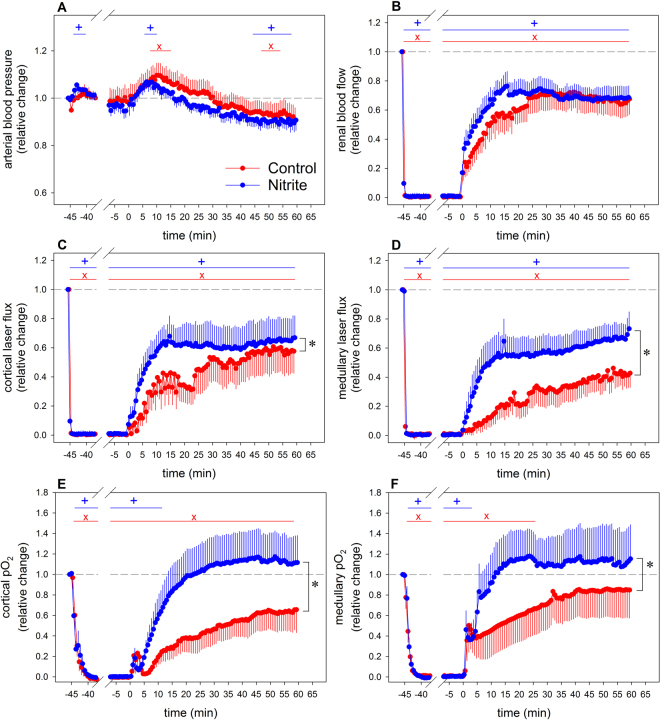
Figure 3.
Response of arterial blood pressure (panel A), total renal blood flow (B), cortical laser flux (C), medullary laser flux (D), cortical tissue pO2 (E), and medullary tissue pO2 (F) to 45 min of unilateral warm renal ischemia (from time −45 min to time 0 min) followed by 60 min of reperfusion. Data are relative changes as related to the values recorded immediately before commencement of the renal ischemia (mean ± SEM; n = 9 for the saline group [control], n = 11 for the nitrite group); *denotes p < 0.05 control vs. nitrite group, significance bars indicate data that significantly differ from their pre-ischemia values, with x denoting p < 0.05 in the control group and +denoting p < 0.05 in the nitrite group.

