Fig. 2.
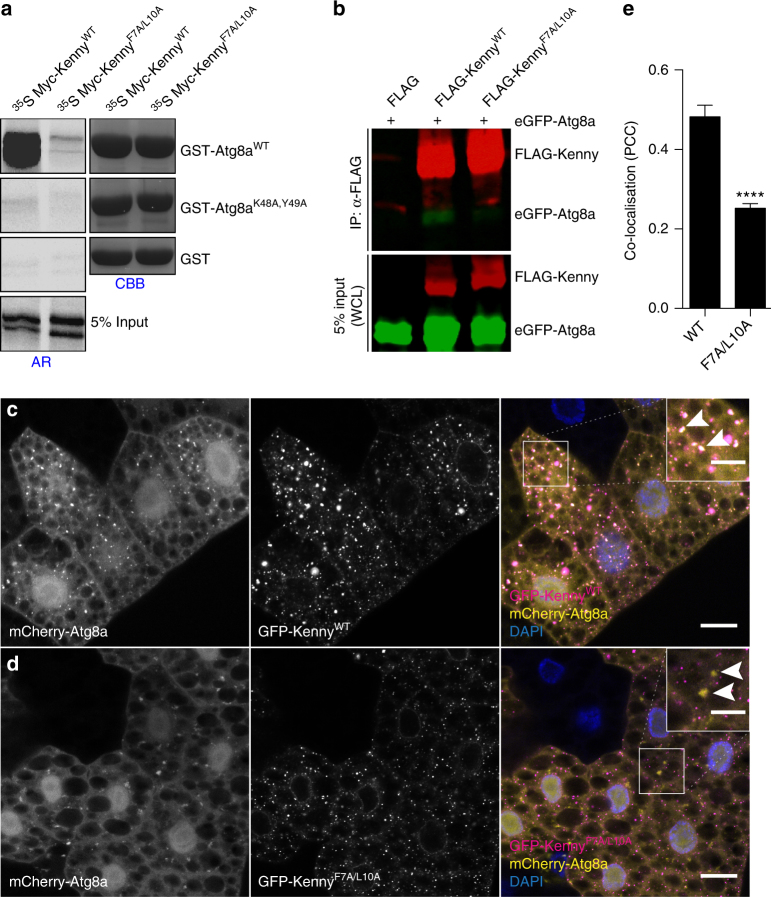
Kenny interacts with Atg8a in a LIR-dependent manner. a GST-pull-down assay between GST-tagged Atg8a-WT or -LDS mutant (K48A, Y49A), and radiolabelled myc-Kenny- WT or -LIR mutant (F7A/L10A). b Anti-Flag immunoprecipitation (IP) between eGFP-Atg8a and Flag-Kenny-WT or –F7A/L10A from whole S2R+ cell lysates (WCL) and subjected to SDS-PAGE. c, d Confocal images of fat body from starved larvae clonally expressing mCherry-Atg8a (yellow) and GFP-Kenny-WT or -F7A/L10A mutant (magenta). Scale bars are 20 µm (10 µm in the insets). Arrowheads in insets show co-localization of mCherry-Atg8a and GFP-Kenny-WT in c and no co-localization in d. e Quantification of the co-localization of mCherry-Atg8a and GFP-Kenny signals using the Pearson’s correlation coefficient. Bar chart shows means ± s.d. Statistical significance was determined using two-tailed Student’s t-test, ****P < 0.001

