Fig. 3.
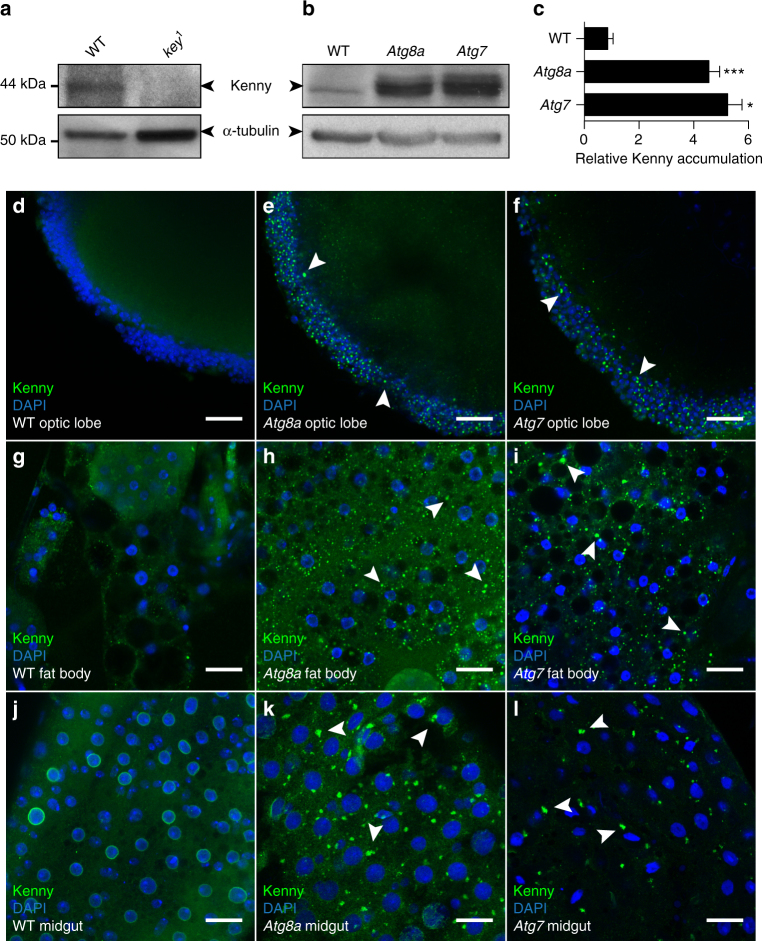
Endogenous Kenny protein accumulates in Atg8a and Atg7 mutant flies. a, b Full body lysates from wild-type (WT) and kenny mutant (key 1) flies a or Atg8a and Atg7 mutant flies b were subjected to SDS-PAGE and immunoblotting for Kenny. Tubulin was used as loading control. c Quantification of the quantity of Kenny protein normalized to tubulin. Bar chart shows means ± s.d. Statistical significance was determined using one-way ANOVA, *P < 0.05, ***P < 0.001. d–l Confocal images from adult brains d–f, fat bodies g–i and midguts j–l from WT d, g, j, Atg8a e, h, k and Atg7 f, i, l mutant flies stained for Kenny (green) and DNA (blue). Arrowheads show some Kenny aggregates. Scale bars are 20 µm

