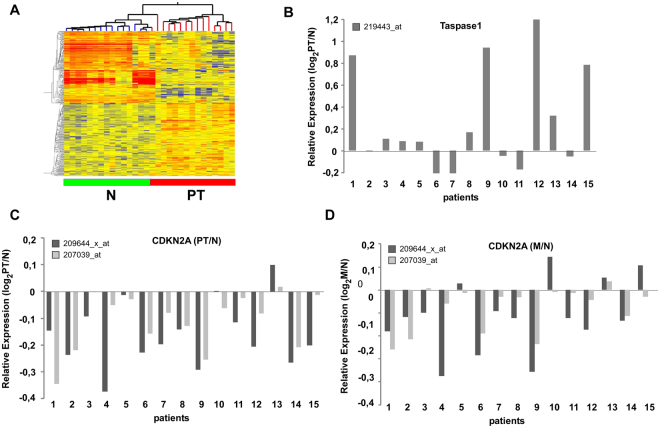
Figure 1.
Genome-wide expression profiling of HNSCC primary tumours (PT) and lymph node metastases (M) versus normal tissue (N). (A) Intrinsic gene set cluster analysis of 45 HNSCC samples. Unsupervised two-way hierarchical clustering and gene tree representation of differentially regulated genes (fold change ≥ 2.0 and p-value < 0.05) allows to separate N and PT. X-axis represents patient samples; y-axis represents the list of probe sets grouped by similarity using Pearson correlation. The comparison of PT versus N revealed 650 deregulated genes. (B–D) Differential expression of Taspase1 (B) and CDKN2A (C,D) in 15 HNSCC tumours. Whereas the protease Taspase1 is overexpressed in primary tumours, CDKN2A expression is significantly downregulated in most PT (p-value < 0.0001) as well as M compared to N (p-value < 0.05). Relative expression levels (log2PT/N; log2M/N) obtained by Affymetrix microarray analysis are shown. CDKN2A locus is represented by two probe sets as indicated.

