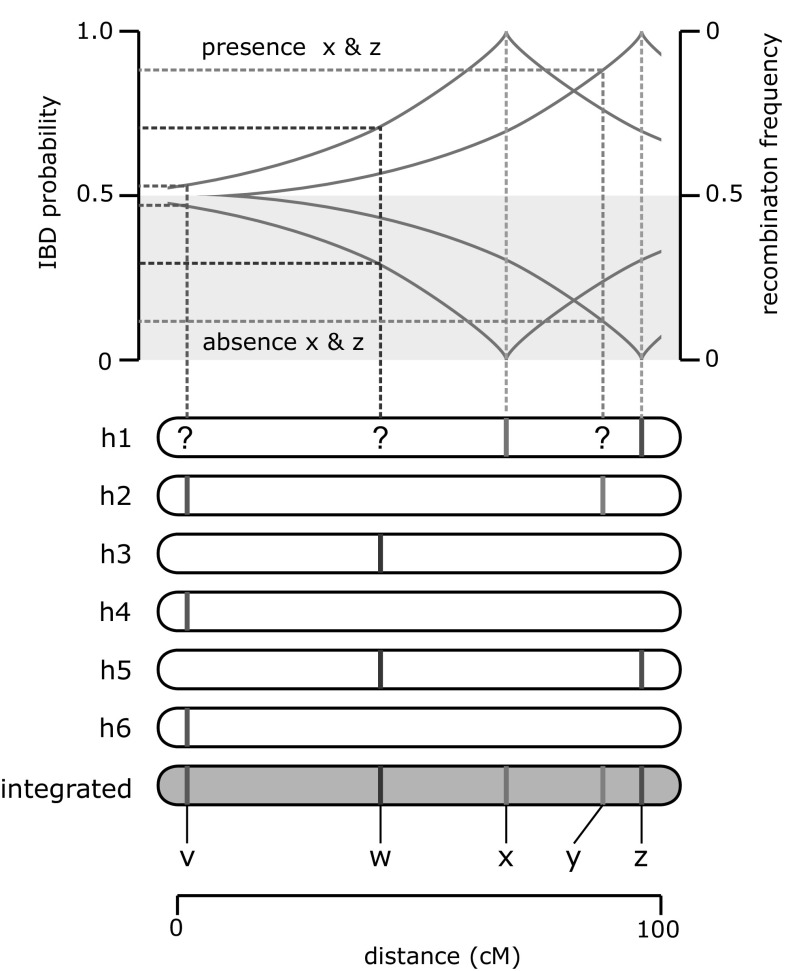
Fig. 2.
Visualisation of an example of estimating of IBD probabilities. A hypothetical integrated linkage map and the separate linkage maps of the six homologues of one parent are shown in dark gray and white, respectively. In the upper panel of the line graph (IBD probability >0.5), the calculation of IBD probabilities for homologue 1 (h1) are shown for marker loci v (pink; triplex), w (purple; duplex) and y (green; simplex) in a situation in which all alleles of marker x (blue; simplex) and z (red; duplex) are inherited. Since all alleles of loci x and z are inherited, these loci get an IBD probability of 1 for inheritance of homologue 1. If only one allele of marker z is inherited, this marker would be uninformative for estimating IBD probabilities, as it is not known from which homologue the single inherited allele originates (could be from h5 or h1). For marker loci v, w and y none of the marker alleles are present on homologue 1. It is therefore not known whether h1 is inherited at these loci. The orange lines depict the relationship between genetic distance and recombination frequency (r), as a function of map distance (Haldane’s function: , where d is distance in Morgan). Because distance between all marker combinations is known based on the integrated map, we estimate the IBD probabilities of loci v, w and y as 1 − r (in case of inheritance of all alleles of x and z), where r is the recombination frequency between the locus of interest and the closest informative marker (which is marker x in the case of w and v, and z in the case of y). The lower panel of the line graph (shaded in gray; IBD probability <0.5) depicts the situation where none of the alleles of loci x and z are inherited. Here, IBD probabilities for v, w and y are estimated as r (colour figure online)

