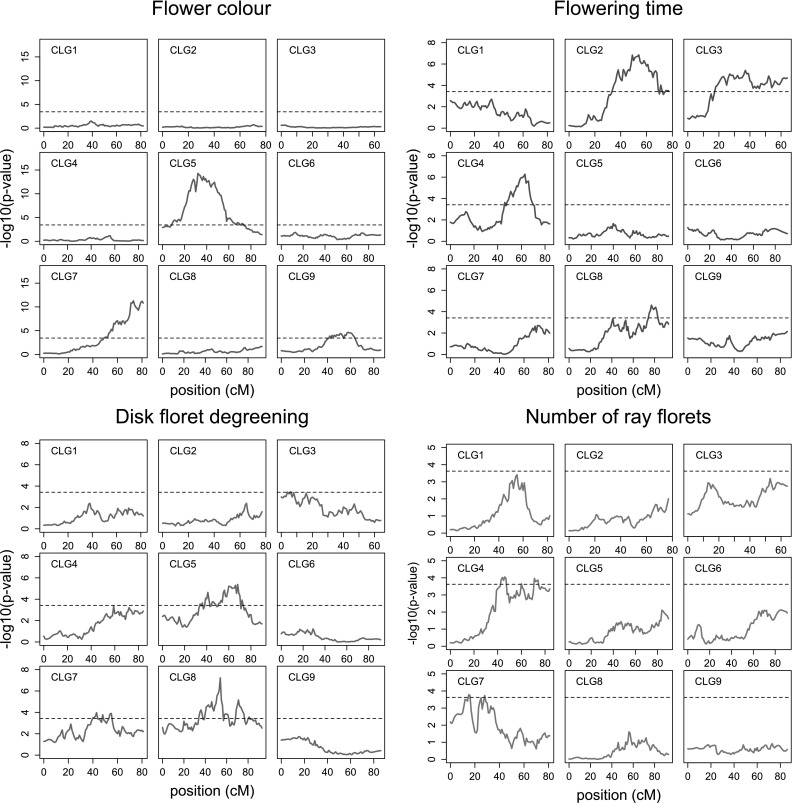
Fig. 7.

QTL analysis of flower colour (purple), flowering time (red), disk floret degreening (green) and number of ray florets (blue). Significance thresholds based on 1000 permutations (see “Materials and methods”) are indicated with the dashed line (colour figure online)
