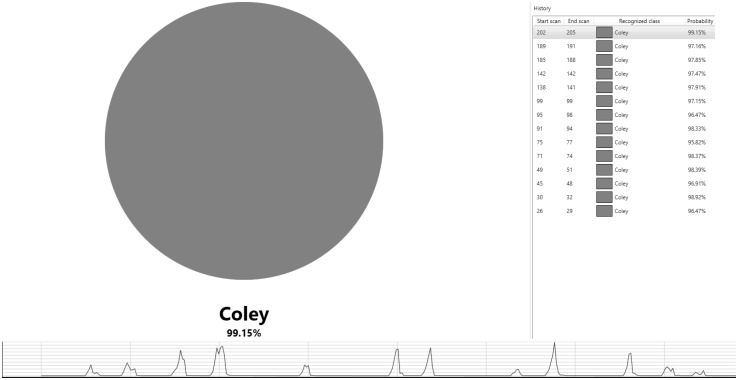
Fig. 2.
Validation of the speciation models using the prototype recognition software and a further set of authenticated fish samples. In this scenario, the sample under investigation is coley and the figure above demonstrates the recognition software correctly identifying a sample burn to be coley (red circle). The results for each burn are obtained near-instantaneously excluding the delay between sampling and appearance of a signal which was ≈ 2 s. Twelve cuts were taken from this sample which is identified in the chromatogram with identification for some of the cuts identified on the right-hand side of the figure. A standard deviation of 5σ was used for class assignment. Of the 99 samples analysed, 98 (98.99%) were correctly identified with one cod sample being assigned as an outlier

