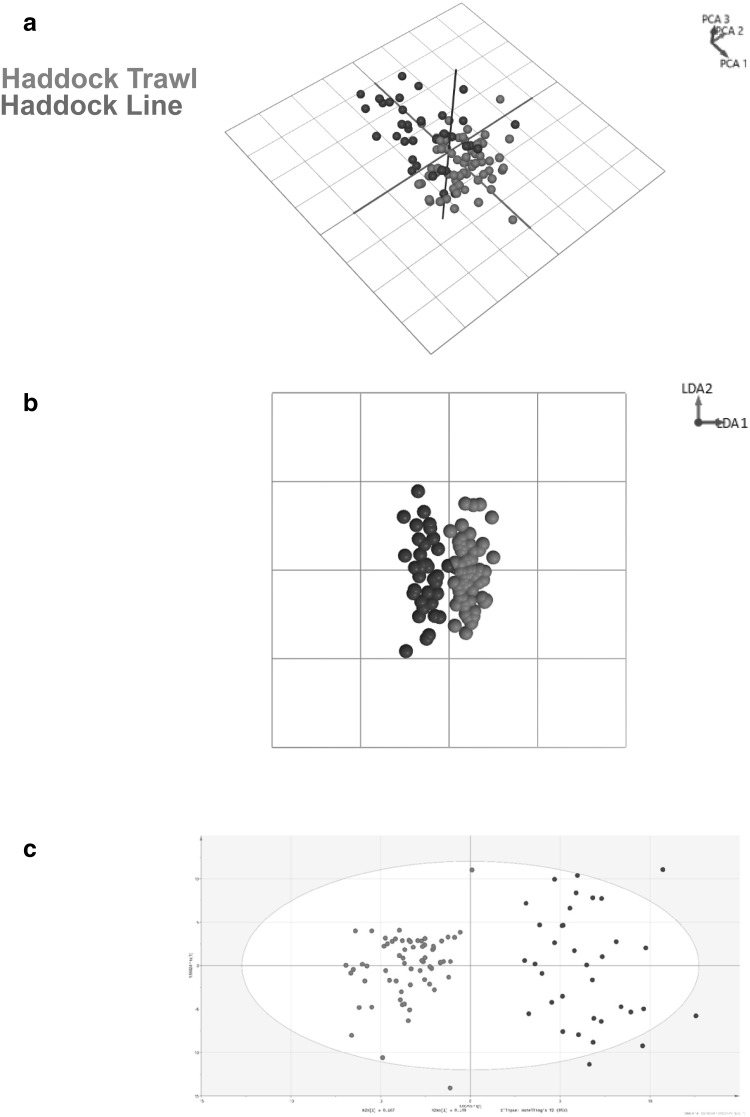
Fig. 3.
a Principal component analysis (PCA), b linear discriminant analysis (LDA) and c orthogonal partial least squares-discriminant analysis (OPLS-DA) models generated using the prototype software and SIMCA 14. All models were generated using the mass range m/z 600–950 of the fish samples with clear separation of the two catch methods; haddock trawl (red) and haddock line (blue) evident within the 2-D LDA and 3-D OPLS-DA models

