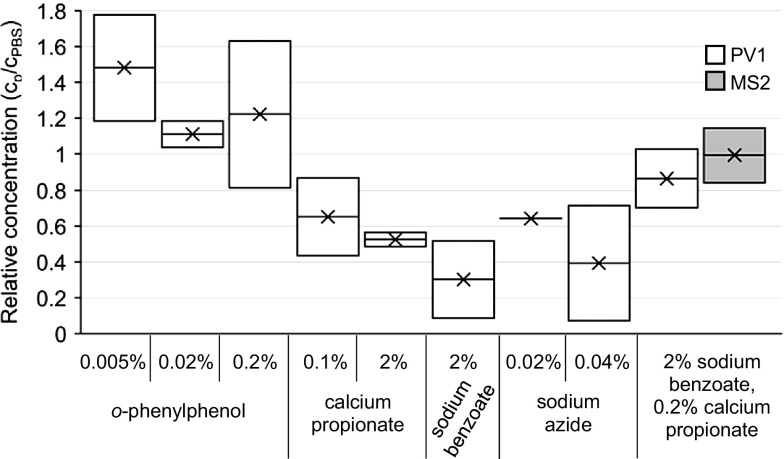
Fig. 2.
Relative concentration of PV1 (white) and MS2 (gray) spiked into eluate from filters dosed with preservatives. Relative concentration was determined by dividing the PV1 or MS2 measured from filters dosed with preservatives by PV1 or MS2 measured in control filters (PBS dosed only). Box and whisker plot: upper, middle, and lower box lines show the first, second, and third quartiles, respectively; markers ‘x’ show the mean (n = 2) (Color figure online)

