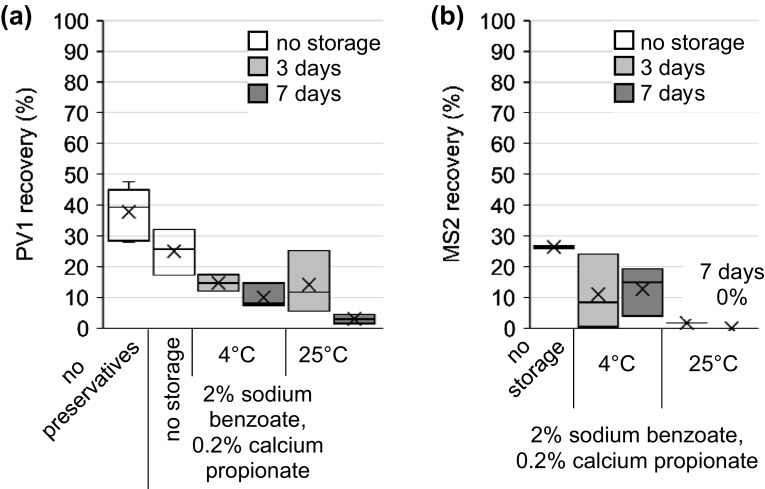
Fig. 6.
Recovery of a PV1 dosed into lake water and b MS2 spiked onto ViroCap filters followed by filtration of the lake water and filter storage with preservatives. Samples were eluted after the indicated time. Box and whisker plot: upper, middle, and lower box lines show the first, second, and third quartiles, respectively; whiskers show the minimum and maximum data points; markers ‘x’ show the mean

