Figure 3.
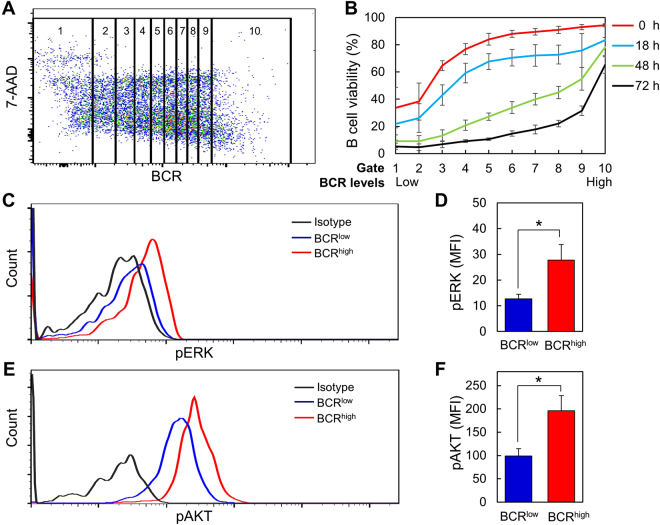
B cells expressing higher levels of BCR have elevated viability and tonic signal than B cells expressing low levels of BCR. (A) B cells were gated into 10 population based on their BCR levels. Each population contained the same numbers of B cells. (B) Viability of each gated B cell population before culture (0 h) and at 18 h, 48 h and 72 h after culture in medium alone. Levels of phosphorylated ERK (pERK) (C and D) and pAKT (E and F) in gated BCRlow and BCRhigh population are shown. Representative FACS profiles (C and E) and mean ± SD of 3 independent experiments (D and F) are shown. Gating strategies are outlined in Supplementary Figure S2. *p < 0.05 (paired t test).

