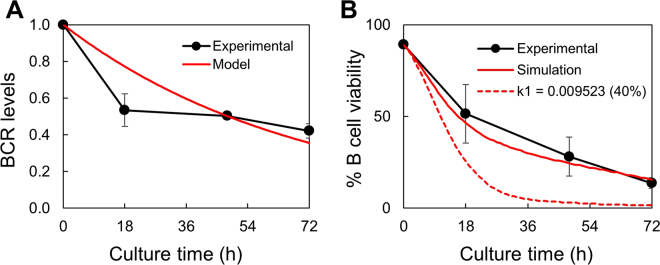
Figure 7.
Simulation of BCR levels and B cell viability. (A) Decrease in BCR levels during culture. The experimental data (same as Fig. 2A) and simulation are shown by black and red lines, respectively. (B) B cell viability in the absence of external stimuli. Actual data (same as Fig. 5, 0 µg/ml of F(ab′)2 α-IgM Abs) and simulation results are indicated by black and red lines, respectively. Dotted red line, simulation results when k 1 was set to ~40% of the original value.

