Fig. 2.
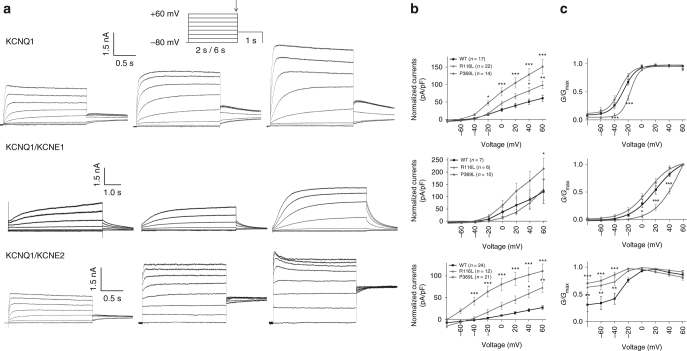
Electrophysiological studies of the WT, KCNQ1-Arg116Leu and KCNQ1-Pro369Leu mutant KCNQ1 proteins. a Representative recordings of currents measured during the voltage-clamp protocol (shown in inset with scale bars) in HEK293 cells transfected with cDNAs encoding wild-type (WT) or mutant (p.Arg116Leu, p.Pro369Leu) KCNQ1 potassium channels: KCNQ1 alone (top row), KCNQ1 and KCNE1 (middle row), or KCNQ1 and KCNE2 (bottom row). b Respective current-voltage relationships normalized for cell size. Peak current analysis was performed at the end of each voltage step. pA/pF: picoamperes per picofarad. c Normalized activation curves, measured 2–4 ms after stepping to −30 mV, as a function of the prior voltage potential. KCNQ1 and KCNQ1/KCNE1 conductance-voltage relation values were fitted to a Boltzmann function. The time constants and slope values were; KCNQ1 WT: −26.2 ± 2.9 mV, 8.6 ± 0.9 (n = 14/3), KCNQ1-R116L: −16.1 ± 1.5 mV, 6.9 ± 0.3 (n = 21/4), KCNQ1-P369L: −30.9 ± 2.5 mV, 6.9 ± 0.6 (n = 14/3), KCNQ1 WT+KCNE1: 21.0 ± 2.5 mV, 16.2 ± 1.7 (n = 18/3), KCNQ1-R116L+KCNE1: 42.4 ± 3.6 mV, 12.7 ± 1.7 (n = 11/2), KCNQ1-P369L+KCNE1: 7.3 ± 3.8 mV, 14.7 ± 0.6 (n = 18/3). Mean ± SEM values are shown. *P < .05, **P < .01, ***P < .001 vs. WT. G/G max: conductance of the channel relative to its maximal conductance

