Fig. 2.
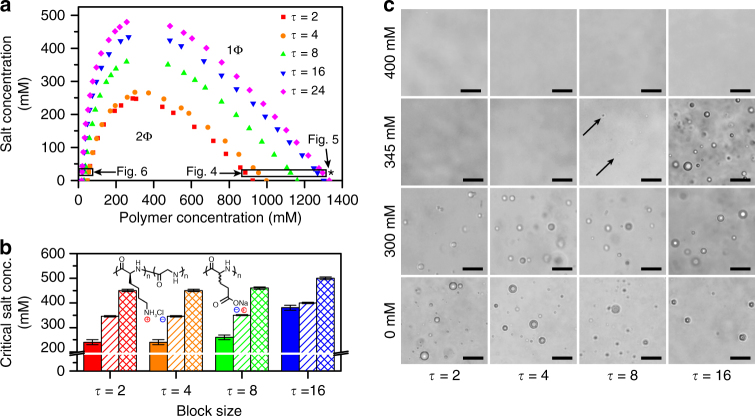
Coacervate phase behavior is affected by charge sequence in both simulation and experiment. a Simulations demonstrate that the size of the coexistence region 2Φ increases with τ. Simulation conditions for Figs. 4–6 are specified by asterisks/boxes, which denote points along the binodal curves at 25 mM NaCl. These points are considered, because the salt concentration values correspond to those used for isothermal titration calorimetry. b The experimental critical salt concentration (CSC) for sequence-defined coacervates at a variety of total charged monomer concentrations (solid 1 mM, stripes 5 mM, crosshatch 50 mM), plotted as a function their periodic block size (τ = 2 to τ = 24). Increasing τ leads to a marked increase in the CSC, qualitatively changing by as much as 50–150 mM, consistent with simulations in a. Error bars reflect the intervals between samples in these experiments. c A selection of optical micrographs corresponding to the data in a, highlighting that the region of coacervation increases with τ. Arrows indicate the presence of tiny coacervate drops. Scale bars are 25 μm

