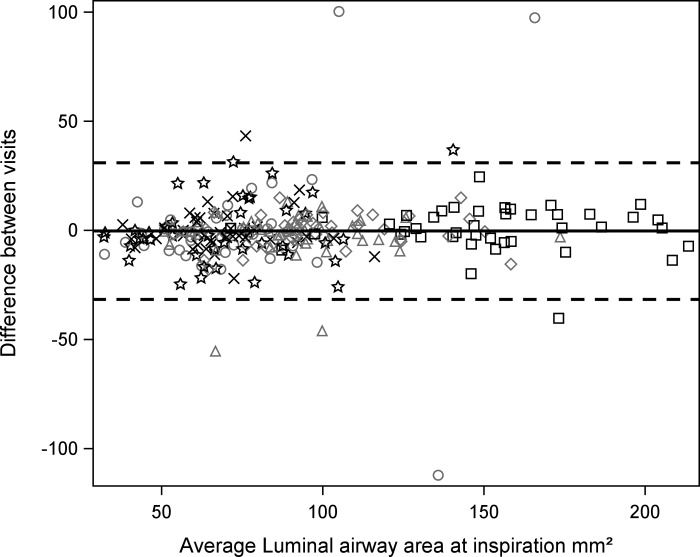
Fig. 2.
Bland-Altman plot showing average of the 2 luminal area measures (mm2) of each of the 258 airways among the 6 airway segments for all the subjects vs. the difference in the 2 size measures (mm2) of each airway at total lung capacity (TLC). △, BronInt; ○, LLB6; ◇, LMB; ×, LUL; □, RMB; ☆, RUL. Note excellent reproducibility at TLC.

