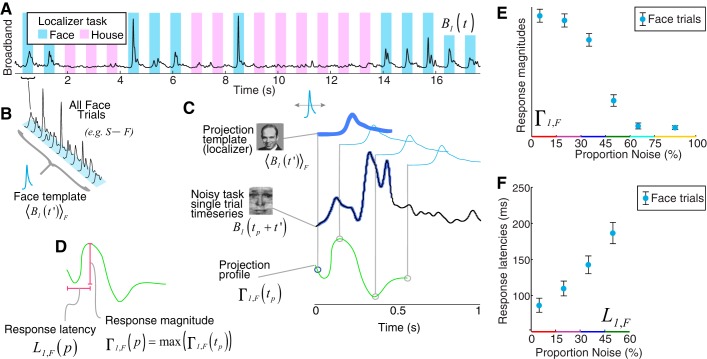
Fig. 2.
Template projection to generate single-trial response magnitudes and latencies. A: broadband from a fusiform electrode in the localizer task. B: template face response generated by averaging across all face trials in the localizer task. C: templates were projected into the noisy task single trial, by using a sliding dot product/covariance function over a 300-ms interval of each noisy task single trial to obtain a projection profile (green trace). D: the “response magnitude” is the maximum of this projection profile, and the latency associated with this maximum is the “response latency.” E and F: single-trial response magnitudes and latencies plotted as a function of noise. Latencies are only plotted up to the 45%–60% noise level, because the template projection is not stable for response traces of ~0 magnitude. (Note the variables indicated are defined and described in methods, Template projection technique.)

