Fig. 4.
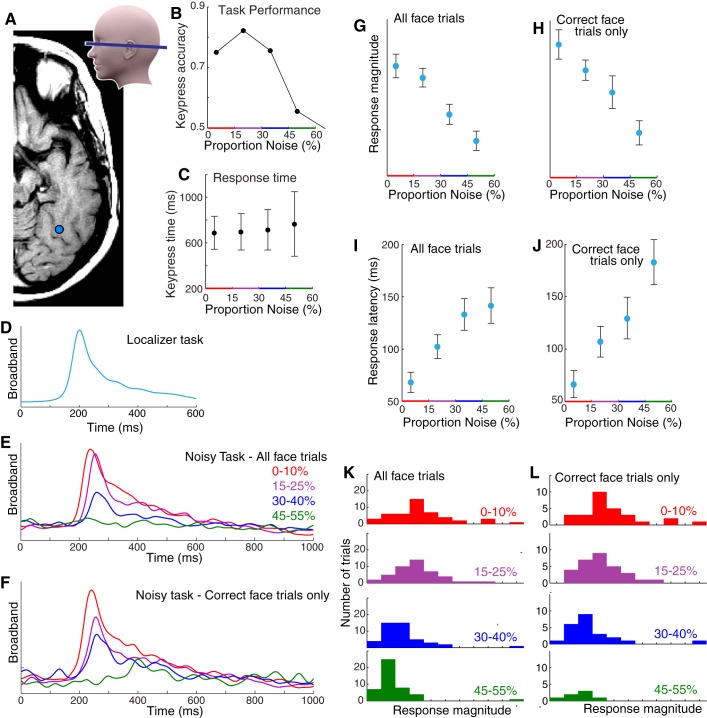
The graded nature of the neuronal population response with noise is unimodal and independent of perception. A: subject 3’s most face-selective electrode (blue). B: subject accuracy, sorted by noise level. C: keypress times, sorted by noise level (note: there was no incentive to respond faster). D: localizer task face template. E: averaged broadband responses to all face stimuli (noisy task). F: same as E, but for correct keypress trials only. G: neurometric function; projection magnitudes of the face template into all noisy task data. Note the graded decrease with increasing noise (rather than all-or-nothing response). H: same as G, but for correct trials only. I: response latencies as a function of image noise. J: same as I, but for correct trials only. This shows that the increasing delay observed with increasing noise cannot be explained by an averaging of correctly and incorrectly perceived face stimuli. K: histogram of response magnitudes, sorted by noise level. L: same as K, but for correct trials only. Note that each distribution is unimodal, indicating that the decremented average traces (E) and response magnitudes (I) with noise are not due to the averaging of an all-or-nothing response but are instead graded with stimulus noise.

