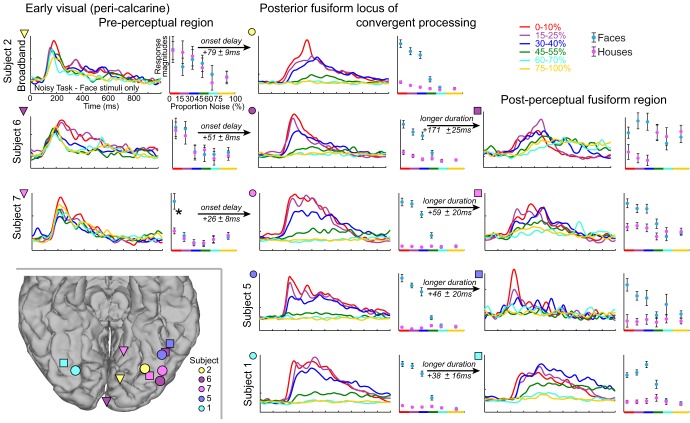
Fig. 9.
Percept formation (conventions are the same as in Fig. 8). Columns show responses from early visual preperceptual locations (left column; inverted triangles in inset), posterior fusiform gyrus loci of confluent processing (middle column; circles in inset), and postperceptual fusiform regions (right column; squares in inset). Each row corresponds to a different subject. Corresponding locations are shown in the inset (bottom left). Note that the large face responses for low noise in the pink triangle site marked with an asterisk are due to several outlier responses for faces (although close examination determined that these were not artifactual). There is an onset delay between all of the early visual areas (left column) and the loci of confluent processing (middle column; significant vs. 0, P < 10−3 for all 3 independently), and that the duration of response was longer in the postperceptual sides (right column) than the loci of confluent processing (middle column; significant vs. 0, P ≤ 0.01 for all 4 independently).

