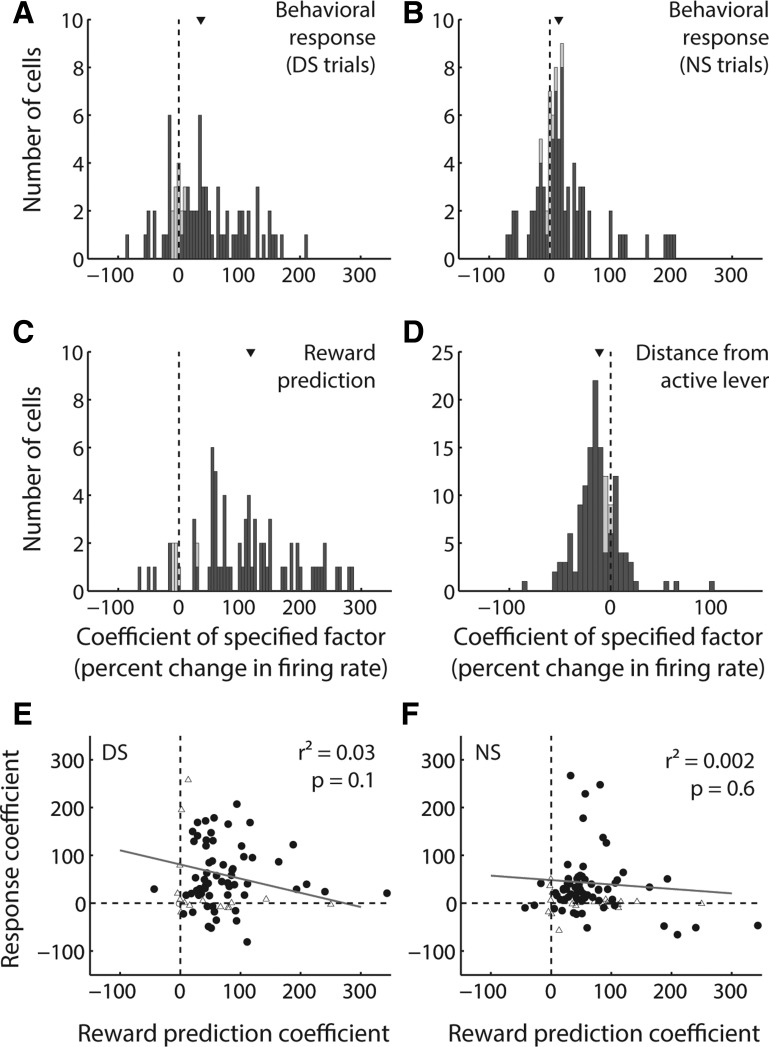
Fig. 11.
Among cue-evoked excitations, reward prediction, behavioral response, and proximity to lever are independent contributors to variance. A–D: distribution of coefficients derived from a GLM with factors of behavioral response on DS trials (A), behavioral response on NS trials (B), reward prediction derived from DS or NS cue identity (C), and distance from the active lever (D). Each coefficient is normalized as the expected change in firing rate over an interdecile shift in the variable (for distance) or a switch in the binary variable (for all other factors). Dark gray bars indicate coefficients derived from significant β values. Arrowhead indicates median of each distribution. The median of each distribution is significantly shifted from zero (P < 0.001, signed-rank test). E and F: reward prediction coefficient (as in C) plotted against behavioral response coefficient (as in A and B) for DS trials (E) and NS trials (F). Solid line is regression line. In neither case is the correlation significant (P > 0.05).

