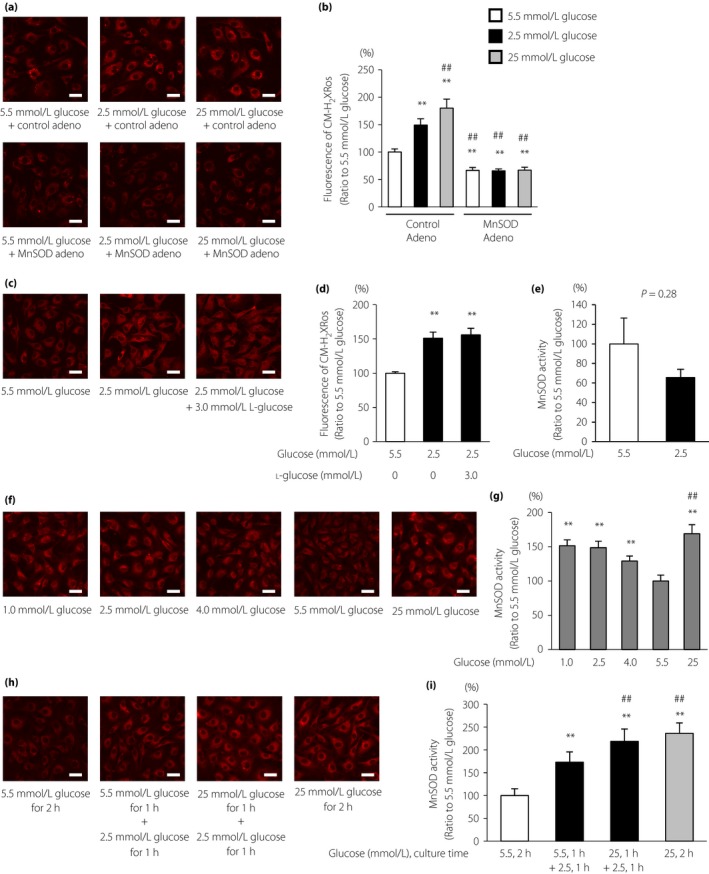
Figure 1.

Low glucose induced mitochondrial reactive oxygen species (mtROS) production. (a) mtROS production in bovine aortic endothelial cells (BAECs) and the effects of manganese superoxide dismutase (MnSOD) overexpression on mtROS production. BAECs overexpressing MnSOD (lower panel) or control adenovirus (upper panel) were incubated under the indicated conditions for 1 h and treated with 300 nmol/L MitoTracker Red CM‐H2XRos (red) for 30 min. Scale bars, 30 μm. (b) The relative fluorescence intensity of MitoTracker Red CM‐H2XRos was measured. Control Adeno, control adenovirus; MnSOD Adeno, MnSOD adenovirus. Data are four independent experiments carried out in duplicate (mean ± SD). **P < 0.01 compared with 5.5 mmol/L glucose and control adenovirus; ## P < 0.01 compared with 2.5 mmol/L glucose and control adenovirus. White bars, 5.5 mmol/L glucose; black bars, 2.5 mmol/L glucose; gray bars, 25 mmol/L glucose. (c) Effects of osmotic pressure on mtROS generation under low glucose conditions. BAECs were incubated under the indicated conditions for 1 h and treated with 300 nmol/L MitoTracker Red CM‐H2XRos (red) for 30 min. Scale bars, 30 μm. (d) The relative fluorescence intensity of the MitoTracker Red CM‐H2XRos probe was measured. Data are four independent experiments carried out in duplicate (mean ± SD). **P < 0.01 compared with 5.5 mmol/L glucose. (e) MnSOD activity in BAECs. BAECs were incubated under the indicated conditions for 1 h. MnSOD activity was measured using a SOD assay kit‐WST. Data are mean ± SD (n = 5/group). (f) The mtROS production in BAECs and the effects of dose‐dependent glucose levels or (h) the fluctuation of glucose levels on mtROS production. BAECs were incubated under the indicated conditions and treated with 300 nmol/L MitoTracker Red CM‐H2XRos (red) for 30 min. Scale bars, 30 μm. (g,i) The relative fluorescence intensity of MitoTracker Red CM‐H2XRos was measured. Data are four independent experiments carried out in duplicate (mean ± SD). **P < 0.01 compared with 5.5 mmol/L glucose; ## P < 0.01 compared with 2.5 mmol/L glucose.
