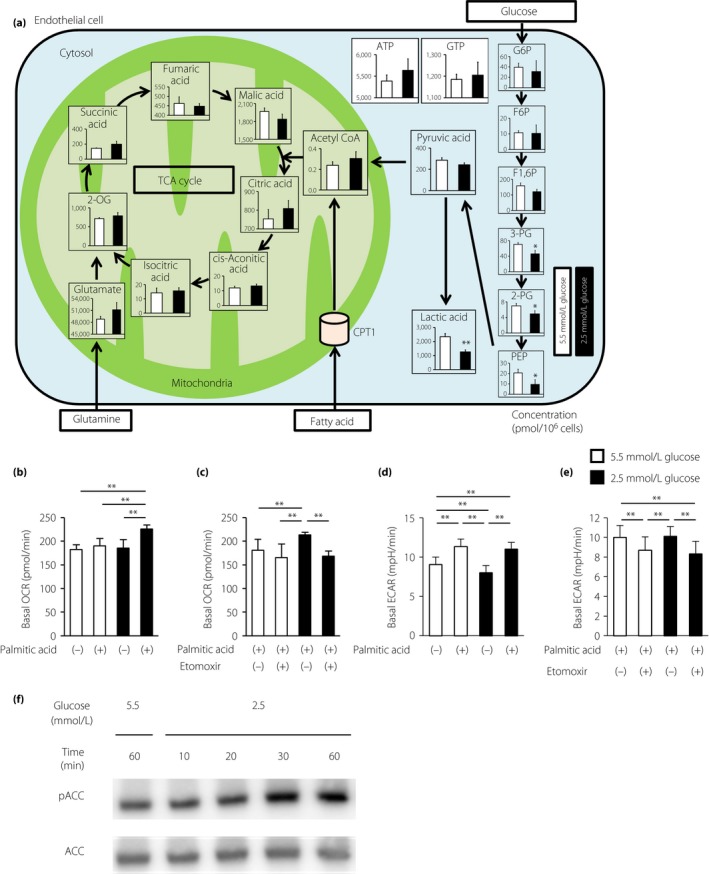
Figure 2.

Low glucose increased fatty acid oxidation in endothelial cells. (a) Metabolome analysis. Intracellular concentrations (pmol/million cells) of key metabolites involved in glycolysis are shown. Error bars indicate standard deviation (n = 3/group). Total metabolites were extracted with methanol from bovine aortic endothelial cells (BAECs) with 5.5 mmol/L glucose (white) or 2.5 mmol/L glucose (black) for 1 h. *P < 0.05, **P < 0.01 vs 5.5 mmol/L glucose. 2‐OG, 2‐oxoglutaric acid; 2‐PG, 2‐phosphoglyceric acid; 3‐PG, 3‐phosphoglyceric acid; F1,6P, fructose 1,6‐diphosphate; F6P, fructose 6‐phosphate; G6P, glucose 6‐phosphate; PEP, phosphoenolpyruvic acid. (b) Basal oxygen consumption rates (OCRs) of BAECs treated with palmitic acid (100 μmol/L) or left untreated. BAECs were incubated under the indicated conditions for 1 h. (c) Basal OCRs of BAECs treated with palmitic acid in the presence of DMSO control or etomoxir (100 μmol/L). (d) Basal extracellular acidification rates (ECARs) of BAECs treated with palmitic acid (100 μmol/L) or left untreated. BAECs were incubated under the indicated conditions for 1 h. (e) Basal ECARs of BAECs treated with palmitic acid in the presence of DMSO control or etomoxir (100 μmol/L). White bars, 5.5 mmol/L glucose; black bars, 2.5 μmol/L glucose. Data are mean ± SD (n = 3–4/group). **P < 0.01. (f) Representative images of protein expression determined by western blotting of BAECs cultured under the indicated conditions for 1 h. ACC, acetyl CoA carboxylase; pACC, phosphorylated acetyl CoA carboxylase.
