Fig. 2.
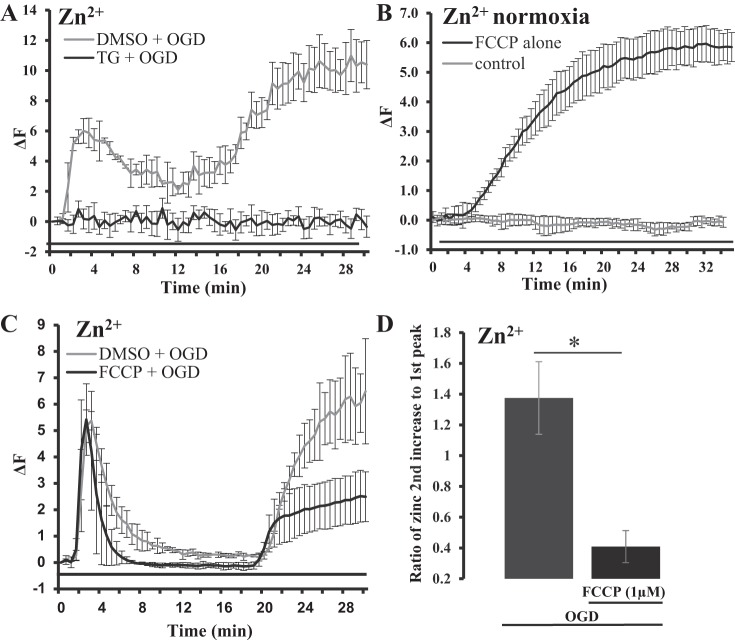
Thapsigargin (TG) and FCCP-sensitive intracellular sources of OGD-induced increases in [Zn2+]i. A: average traces of Zn2+ fluorescence during OGD treatment in HeLa cells with or without TG pretreatment (2 µM). Black trace represents cells pretreated with TG for 20 min before the induction with OGD (TG + OGD), where the baseline is normalized to the elevated Zn2+ before OGD exposure (n = 12 in two separate experiments). Gray trace represents control (DMSO + OGD) cells pretreated with 0.1% DMSO before induction of OGD (TG was dissolved in DMSO; n = 15 cells in two separate experiments). The black line under the traces represents the duration of OGD treatment. Error bars are standard deviation. B: average trace of Zn2+ fluorescence (FluoZin-3, AM), showing FCCP-induced [Zn2+]i rises during normoxic conditions (1 µM FCCP; n = 12 cells from two separate experiments); baseline is normalized to starting elevated Zn2+ level. The black line under the traces represents FCCP treatment. Error bars are standard deviation. C: average traces of Zn2+ fluorescence in HeLa cells that were pretreated with or without FCCP before OGD treatment. Black trace represents cells pretreated with FCCP for 10 min and after washout of FCCP before OGD treatment (n = 20 from three separate experiments). Gray trace represents control cells pretreated with 0.1% DMSO before exposure to OGD (control, n = 10 cells from two separate experiments). D: bar graph showing ratio of peak fluorescence intensity of the second OGD-induced Zn2+ rise divided by peak fluorescence intensity of the first Zn2+ rise. Error bars represent standard deviation (*P = 0.0017; FCCP, n = 20; control, n = 10).

