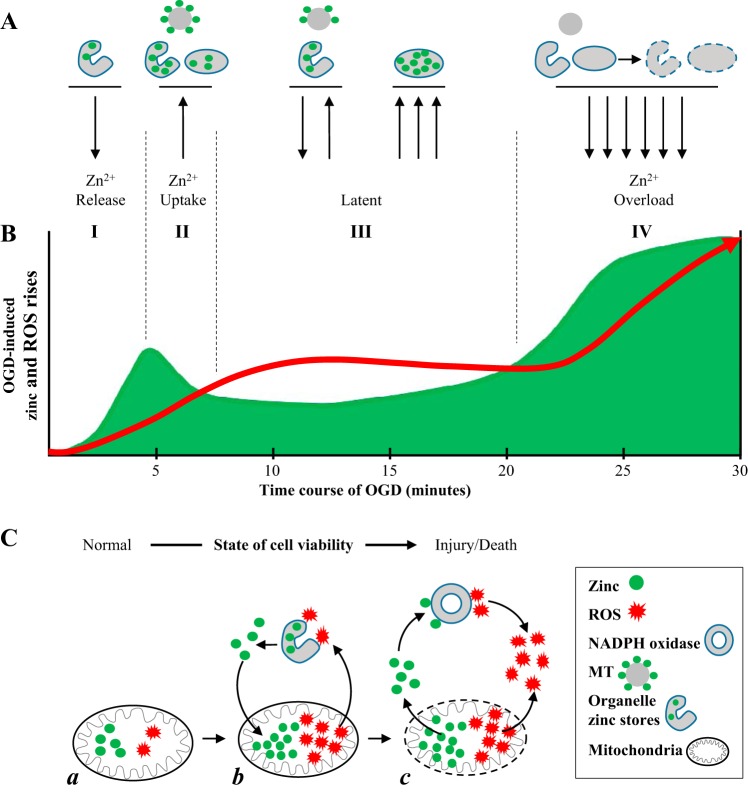
Fig. 5.
Summary of cross talk between OGD-induced Zn2+ and ROS increases that involve intracellular Zn2+ storage, mitochondria, and NADPH oxidase. A: schematic drawing of intracellular Zn2+ storage including metallothioneins (MT), organelle apparatus such as endoplasmic reticulum, and mitochondria, showing the release and uptake of Zn2+ by them in four described phases of Zn2+ rises during OGD. B: diagram of temporal relationship of OGD-induced Zn2+ and ROS accumulation during the course of prolonged hypoxic exposure (30 min in the present study). Green area represents Zn2+ increases; red line shows ROS accumulation. Roman numerals and vertical dashed lines show four phases of Zn2+ transient during OGD. C: schematic drawing showing mitochondrial Zn2+ storage and release during OGD in relationship with mitochondrial ROS production and NADPH oxidase-mediated ROS production. C,a: before OGD. C,b: mitochondria uptake and store Zn2+ during OGD. Drawing shows the positive feedback between mitochondrial Zn2+ stress facilitating ROS production, which further releases Zn2+. C,c: the large release of Zn2+ and ROS from mitochondria. Zn2+ may activate NADPH oxidase and consequently further increase ROS accumulation.

