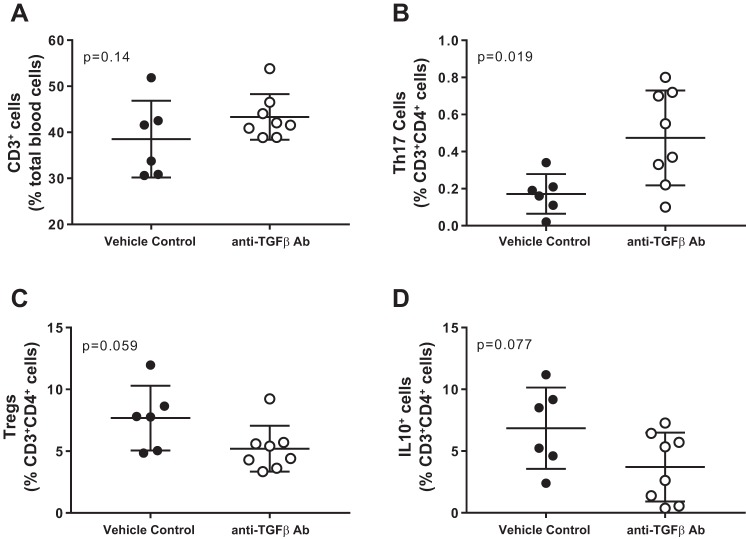
Fig. 5.
T-cell profile in whole blood from female SHR-treated with vehicle (n = 7; ●) or a monoclonal antibody against TGF-β1,2,3 for 21 days (n = 8; ○). Shown are the percent of CD3+ T cells (A), ROR-γt+ Th17 cells (B), Foxp3+ Tregs (C), and IL-10+ T cells (D). Data were compared via Studentʼs t-test.

