Fig. 1.
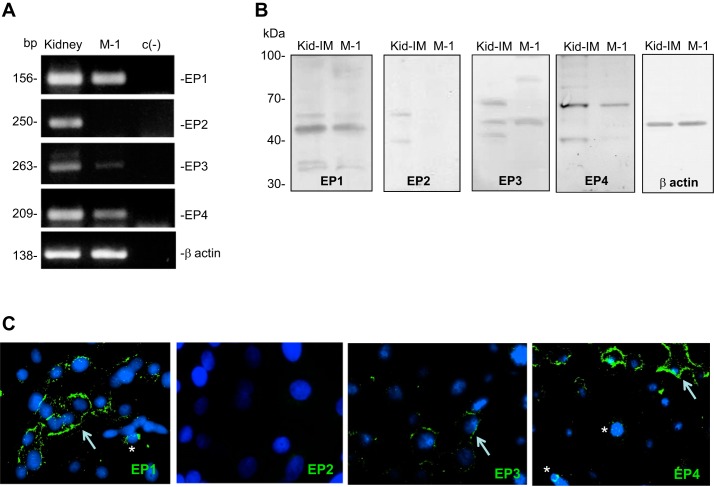
E-Prostanoid receptors in M-1 collecting duct cells. A: primers used for qRT-PCR were used in a conventional PCR to demonstrate the specificity of the band. These results also demonstrated the robust amplification of the mRNA for EP1 and EP4 receptors and EP3, to a lesser extent. The EP2 receptor was not detectable in M-1 cells. Housekeeping gene β-actin is also shown. PCR product size is shown in base pairs (bp). c(-), negative control without template. B: protein expression of EP receptors in the kidney inner medulla (Kid-IM) and M-1 cells detected by Western blot. Molecular mass is shown in kilodaltons (kDa). EP1 was detected at the expected molecular mass (42 kDa). For EP3, a second band was detected at 70 kDa. The expected band (52 kDa) for the EP4 receptor was abundantly expressed in whole mouse kidney but diffusely detected in M-1 cells. C: immunocytochemistry in M-1 cells showing the expression of EP receptors in the plasma membrane (arrows) and perinuclear pattern (asterisks). EP2 was not detected. Positive labeling, green.

