Fig. 2.
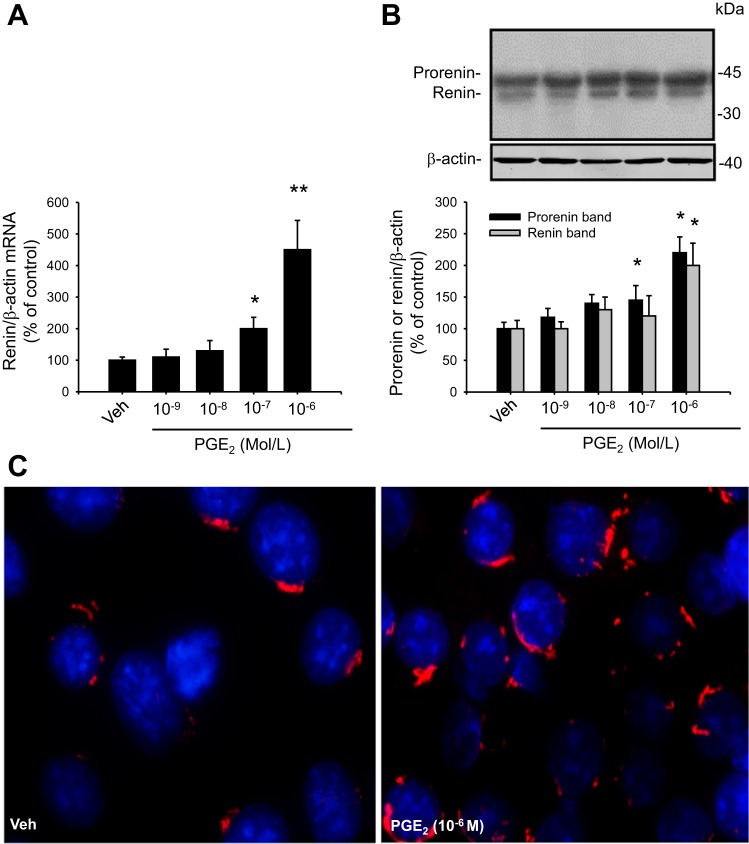
PGE2 increases renin mRNA and prorenin/renin protein levels in M-1 cells. A: dose-response curve from 10−9 to 10−6 M PGE2 for renin mRNA levels after 6 h treatment. B: dose-response curve from 10−9 to 10−6 M PGE2 for prorenin/renin protein levels after 6 h treatment. Band identity of prorenin and renin bands in collecting duct cells and medullary renal tissues is described previously (10, 12, 23). C: renin immunofluorescence in M-1 cells treated with vehicle (Veh; ethanol) or PGE2 at 10−6 M. *P < 0.05, **P < 0.01 vs. Veh, n = 6. Immunostaining demonstrated perinuclear pattern.

