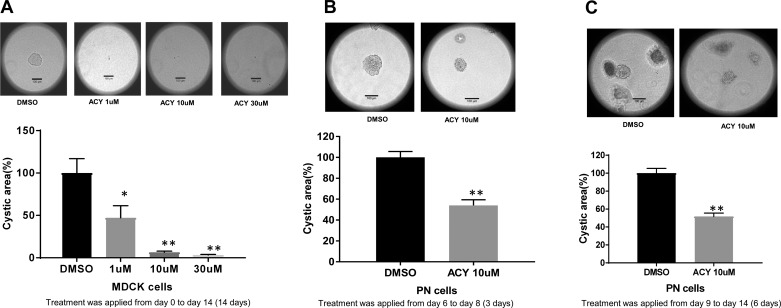
Fig. 3.
A: ACY-1215 reduces cyst growth in MDCK.2 cells. Representative images of MDCK cells treated with either DMSO or ACY-1215. Treatment was applied to MDCK.2 cells grown in 3-dimensional (3D) culture from the beginning of the culture period. In the summary data for the in vitro cystogenesis experiment, bars represent averages ± SE. MDCK cells were treated with DMSO or ACY-1215 (1, 10, 30 µM) on days 0, 2, 4, 6, 8, 10, 12, and 14; images were taken on day 16. Bars represent means ± SE (n = 6). The average cyst from the DMSO group was considered 100%, and the rest of the cysts were compared with this cyst. B and C: ACY-1215 shrinks established cysts in MDCK.2 cells. B: representative images of PKD1 null (PN) cells treated with either DMSO or ACY-1215. Cysts were allowed to grow for 6 days. There were no statistically significant differences in cyst area among the groups. The cysts were then treated with DMSO or ACY-1215 on days 6, 7, and 8; images were taken on day 9. Note that the summary data show that ACY-1215 reduces the size of already-established cysts. C: representative images of PN cells treated with either DMSO or ACY-1215. Cysts were allowed to grow for 9 days and were statistically the same size for all groups. Cells were then treated with DMSO or ACY-1215 (10 µM) on days 9, 10, 11, 12, 13, and 14; images were taken on day 16. Note that the summary data show that ACY-1215 reduced the size of already-established cysts. Bars represent means ± SE (n = 5 for A and 6 for B). The mean size of the cysts from the DMSO group was considered 100%, and the size of the rest of the cysts was compared with this size. *P < 0.05 and **P < 0.01. One-way ANOVA and Student’s t-test were used for statistics.

