Fig. 2.
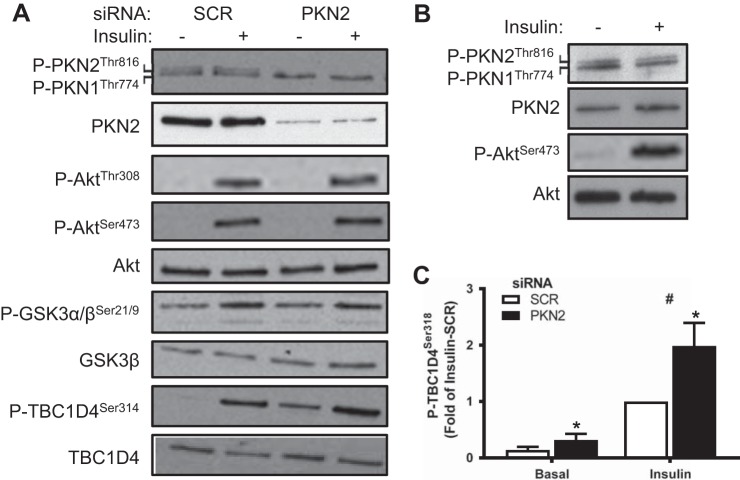
PKN2 knockdown increases TBC1D4 phosphorylation in HSMCs. A:Western blot analysis of PKN2, Akt, GSK-3, and TBC1D4 protein and phosphorylation from basal and insulin-stimulated (120 nM; 15 min) primary HSMCs (representative immunoblot from n = 5 biological replicates). B: Western blot analysis of PKN2 and Akt protein and phosphorylation in mouse quadriceps muscle 15 min following saline or insulin (5 IU/kg ip) injection (representative immunoblot from n = 4 mice). C: quantification of phosphorylated (p)-TBC1D4 Ser318 abundance in basal and insulin-stimulated primary HSMCs. Open bars, SCR; black bars, siPKN2. *PKN2 effect, P < 0.05; #insulin main effect, P < 0.05. Results are means ± SE for n = 5 biological replicates.

