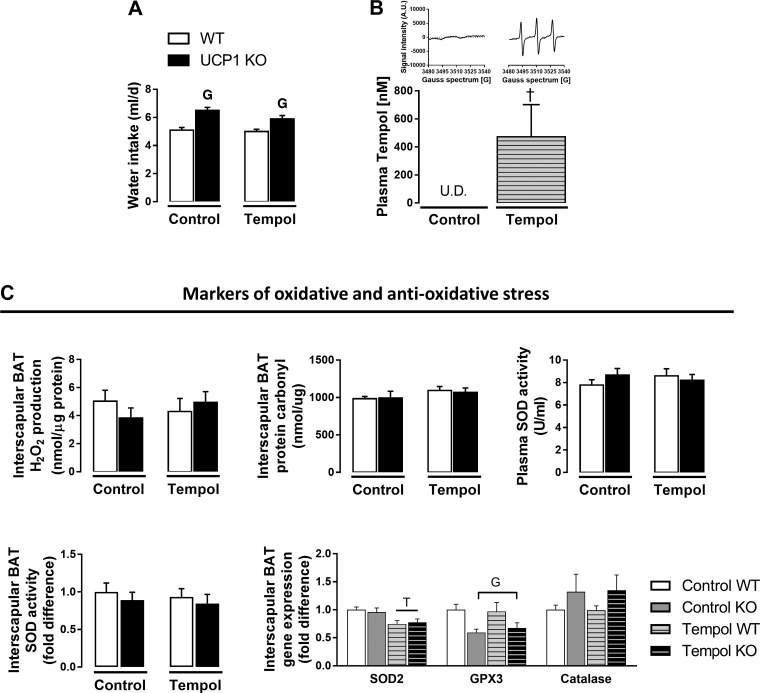
Fig. 4.
Effects of tempol administration for 8 wk and UCP1 ablation on oxidative and antioxidative stress. A: water intake. B: plasma tempol levels and representative EPR spectra (inset). C: interscapular BAT H2O2 generation, protein carbonyls, plasma and interscapular BAT SOD activity, and antioxidant mRNA markers in interscapular BAT. Data are expressed as means ± SE. BAT, brown adipose tissue; WT, wild-type; KO, knockout; H2O2, hydrogen peroxide. GP < 0.05 main effect of genotype. †P < 0.05 main effect of treatment. N = 9–13/group for water intake and oxidative stress markers. A subset of animals was used for analysis of circulating levels of tempol (controls, n = 8; tempol, n = 8).

