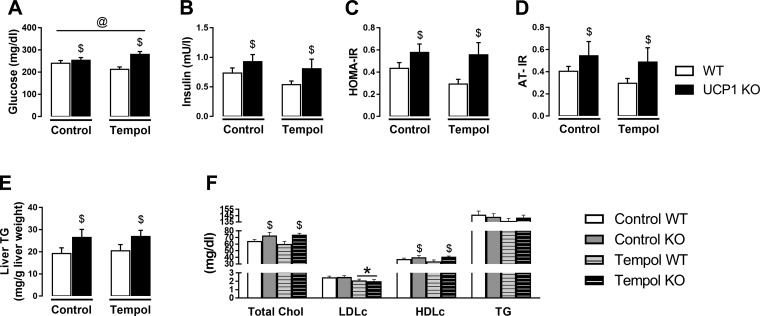
Fig. 5.
Effects of tempol administration for 8 wk and UCP1 ablation on insulin resistance, fatty liver, and blood lipids in WT and UCP1 KO mice. A: fasting glucose. B: fasting insulin. C: HOMA-IR. D: AT-IR. E: liver TG. F: blood lipids. Data are expressed as means ± SE. AT, adipose tissue; WT, wild-type; KO, knockout; HOMA-IR, homeostasis model assessment of insulin resistance; AT-IR, adipose tissue insulin resistance; TG, triglycerides. *P < 0.05, main effect of treatment; $P < 0.05, main effect of genotype; @P < 0.05, treatment × genotype interaction. n = 9–13/group.

