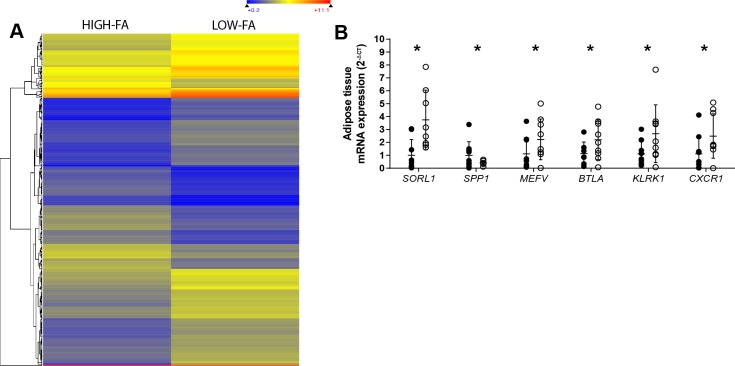
Fig. 4.
Microarray and gene expression analysis of adipose tissue. A: heat map representing genes twofold differentially expressed in LOW-FA compared with HIGH-FA. B: qPCR validation of mRNA expression of six genes found to be greater than twofold different in LOW-FA (n = 9, ∘) compared with HIGH-FA (n = 9, •). Expression values were normalized to the mean of the housekeeping genes PPIA and B2M and then expressed relative to HIGH-FA. Data are expressed as means ± SD. *P < 0.05 vs. HIGH-FA.

