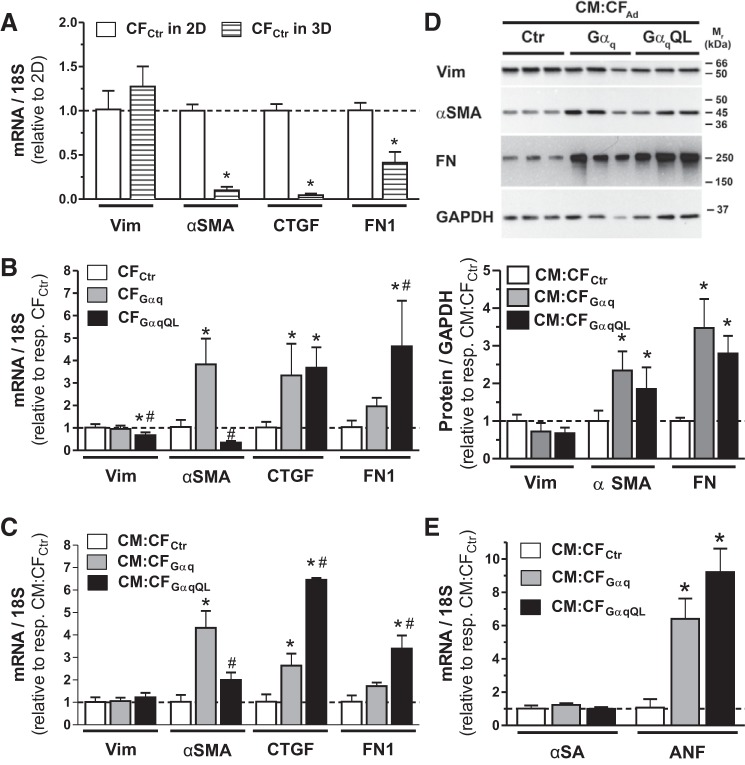
Fig. 3.
Cardiac fibroblast (CF)-restricted Gαq overexpression leads to CF activation and atrial natriuretic factor (ANF) expression. CFs were infected with the indicated adenoviruses for 2 h before being seeded. CFs were seeded alone in standard two-dimensional (2-D) culture (A) or were seeded in hydrogels in three-dimensional (3-D) culture alone (CFAd; B) or together with CMs (1:1, CM:CFAd) (C–E). After the indicated days, cells or microtissues were harvested for mRNA extraction (pooled from 2−3 wells for each condition, 6-well and 12-well plates for 2-D and 3-D, respectively) or protein extraction (pooled from 3 hydrogels in 6-well format for each condition). A: relative mRNA expression for the indicated proteins assessed by quantitative PCR (qPCR) analysis of cells cultured in 2-D monolayers or in 3-D as described. Values are means ± SD; n = 5–6 per condition. *P < 0.05 vs. 2-D (Student’s t-test). B and C: relative mRNA expression for the indicated proteins in CFAd (B) or CM:CFAd microtissues (C) assessed by qPCR analysis after 3 days in 3-D culture. Values are means ± SD for n = 6 (B) or n = 3 (C) samples/condition. *P < 0.05 vs. control (Ctr); #P < 0.05 vs. Gαq (ANOVA). D, top: representative Western blots of microtissue lysates after 2 days in 3-D culture (10 µg protein/lane) probed with the indicated antibodies. GAPDH was used as the loading control. Similar changes were observed after 3 and 4 days in culture (not shown). Bottom: pooled group data. Values are means ± SD; n = 4–7 samples/condition. *P < 0.05 vs. Ctr (ANOVA). E: relative mRNA expression of the indicated proteins in CM:CFAd microtissues assessed by qPCR analysis after 3 days in 3-D culture. Values are means ± SD; n = 3 samples/condition. *P < 0.05 vs. Ctr (ANOVA). αSA, α sarcomeric actinin; αSMA, α-smooth muscle actin; CTGF, connective tissue growth factor; FN, fibronectin; Vim, vimentin.

