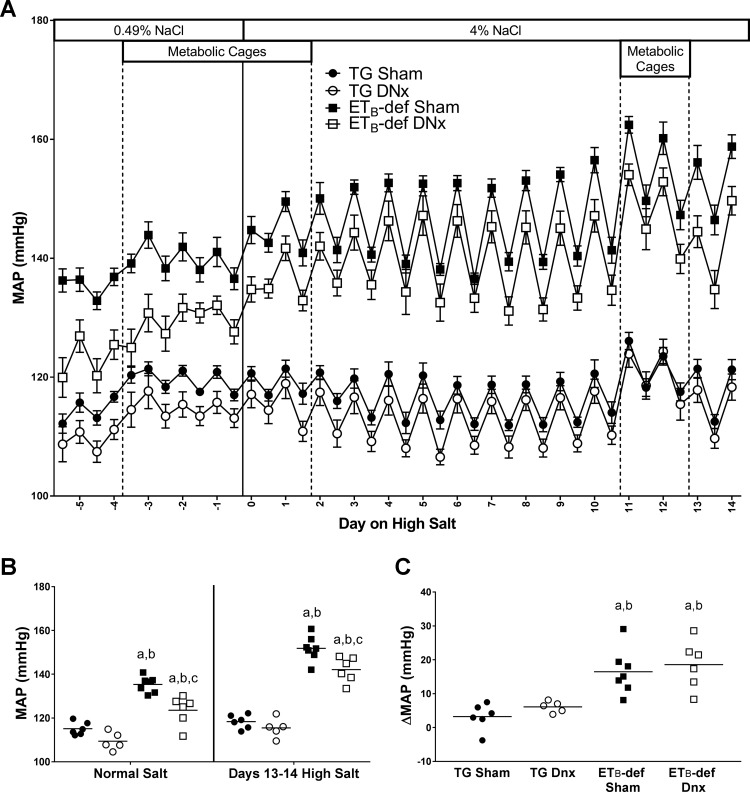
Fig. 1.
Mean arterial pressure (MAP) throughout the experimental protocol. A: active/inactive MAP during normal salt and high-salt diet. B: 24-h MAP during normal salt diet and days 13–14 of high-salt diet. C: change in MAP from normal salt to days 12–14 of high-salt diet. DNx, denervated; TG, transgenic; ETB, endothelin B. aP < 0.05 vs. TG sham; bP < 0.05 vs. TG DNx; cP < 0.05 vs. ETB-def sham; two-way ANOVA with Sidak’s post hoc test for multiple comparisons (B); one-way ANOVA with Tukey’s post hoc test for multiple comparisons (C). DNx, denervated; TG, transgenic; ETB, endothelin B.TG sham, n = 6; TG DNx, n = 5; ETB-def sham, n = 7; ETB-def DNx, n = 6.

