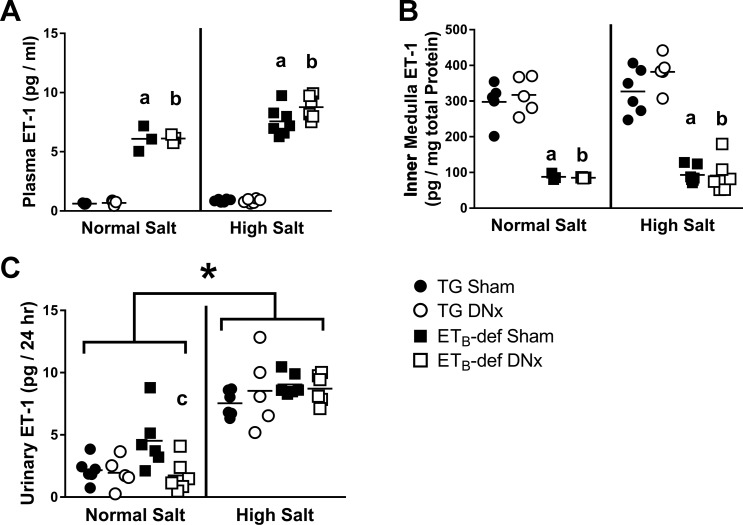
Fig. 6.
ET-1 levels during normal salt and high-salt diets. A: plasma endothelin-1 (ET-1) content. B: renal inner medullary ET-1 content. C: renal production of ET-1 measured by 24-h urinary excretion of ET-1. DNx, denervated; TG, transgenic; ETB, endothelin B. aP < 0.05 vs. TG sham; bP < 0.05 vs. TG DNx; cP < 0.05 vs. ETB-def sham; one-way ANOVA with Tukey’s post hoc test for multiple comparisons (A–C). *P < 0.05 active vs. inactive period by two-way ANOVA; two-way ANOVA with Sidak’s post hoc test for multiple comparisons (C). TG sham, n = 6; TG DNx, n = 5; ETB-def sham, n = 7; ETB-def DNx, n = 6.

