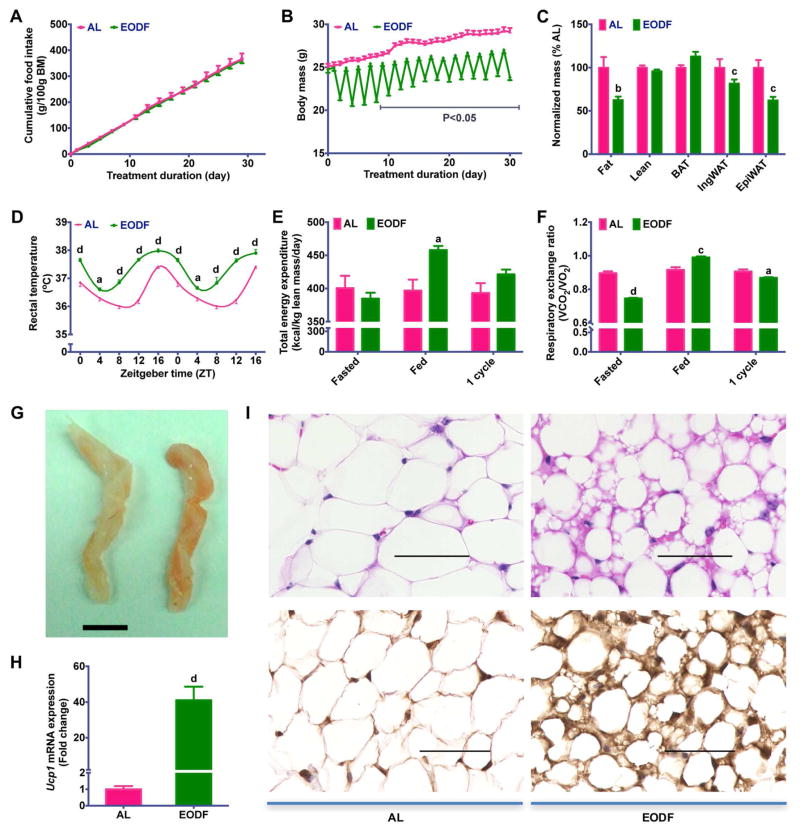
Figure 1. EODF treatment increases energy expenditure through WAT beiging.
(A) Cumulative food intake. n=14–16 mice/group.
(B) Body weight. n=14–16 mice/group.
(C) Normalized mass of body depots. n=7–8 mice/group.
(D) Circadian rectal temperature on fed day. n=14–16 mice/group.
(E–F) Daily total energy expenditure (E) and respiratory exchange ratio (F) during one cycle of EODF. On day 1 (“Fasted”), the EODF mice were fasted while the AL mice fed a chow diet. On day 2 (“Fed”), both groups had ad libitum access to chow. Data marked as “1 cycle” show the average value of the two days (“Fasted” plus “Fed”). n=4 mice/group.
(G) Representative image for inguinal WAT of AL(left) and EODF (right) mouse. Scale bar: 5 mm.
(H) Ucp1 mRNA expression in inguinal WAT in the fed state. n=7–8 mice/group.
(I) Representative H&E (upper) and UCP1 (lower) staining of inguinal WAT sections. Scale bar: 50 μm.
Data are presented as mean ± SEM. Different lowercase letters indicate different statistical significance by two-tailed unpaired t-test, a, p < 0.05; b, p < 0.01; c, p < 0.005; and d, p < 0.001 versus AL.
See also Figure S1–S5.

