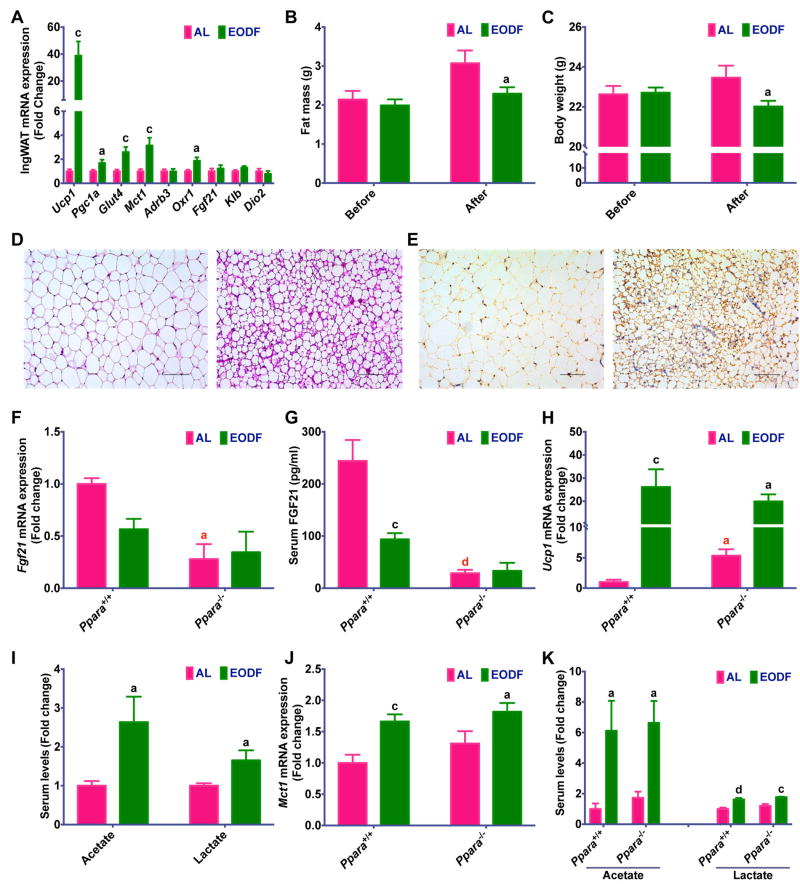
Figure 2. EODF induces inguinal WAT beiging independent of β-AR and FGF21 signaling.
(A) mRNA expression of thermogenic genes in inguinal WAT of mice under 30°C in the fed state. n= 10 mice/group.
(B) Body weight of mice before and after EODF treatment at 30°C. n= 10 mice/group.
(C) Fat mass of mice before and after EODF treatment at 30°C. n= 10 mice/group.
(D) Representative H&E staining of inguinal WAT sections from EODF (at 30°C) mice (right) and AL mice (left). Scale bar: 100 μm.
(E) Representative UCP1 immunohistochemical staining of inguinal WAT sections from EODF (at 30°C) mice (right) and AL mice (left). Scale bar: 100 μm.
(F–G) Liver Fgf21 mRNA expression (F) and serum FGF21 levels (G) of Ppara wild-type (Ppara+/+) and Pparα null (Ppara−/−) mice with or without EODF treatment in the fed state. n = 5 mice/group.
(H) mRNA expression of Ucp1 in inguinal WAT of Ppara+/+ and Ppara−/− mice with or without EODF treatment in the fed state. n = 5 mice/group.
(I) Serum acetate and lactate levels of mice at 30°C. n= 10 mice/group.
(J) mRNA expression of Mct1 in inguinal WAT of Ppara+/+ and Ppara−/− mice with or without EODF treatment in the fed state. n = 5 mice/group
(K) Serum acetate and lactate levels of Ppara+/+ and Ppara−/− mice with or without EODF treatment. n = 5 mice/group.
Data are presented as mean ± SEM. Different lowercase letters indicate statistical significance by two-tailed unpaired t-test, a, p < 0.05; c, p < 0.005; and d, p < 0.001. Black letters show the effects of EODF (EODF versus AL within the same strain), red letters the effects of Ppara knockout (Pparα−/− versus Ppara+/+ mice within the same treatment). SCFAs, short chain fatty acids.

