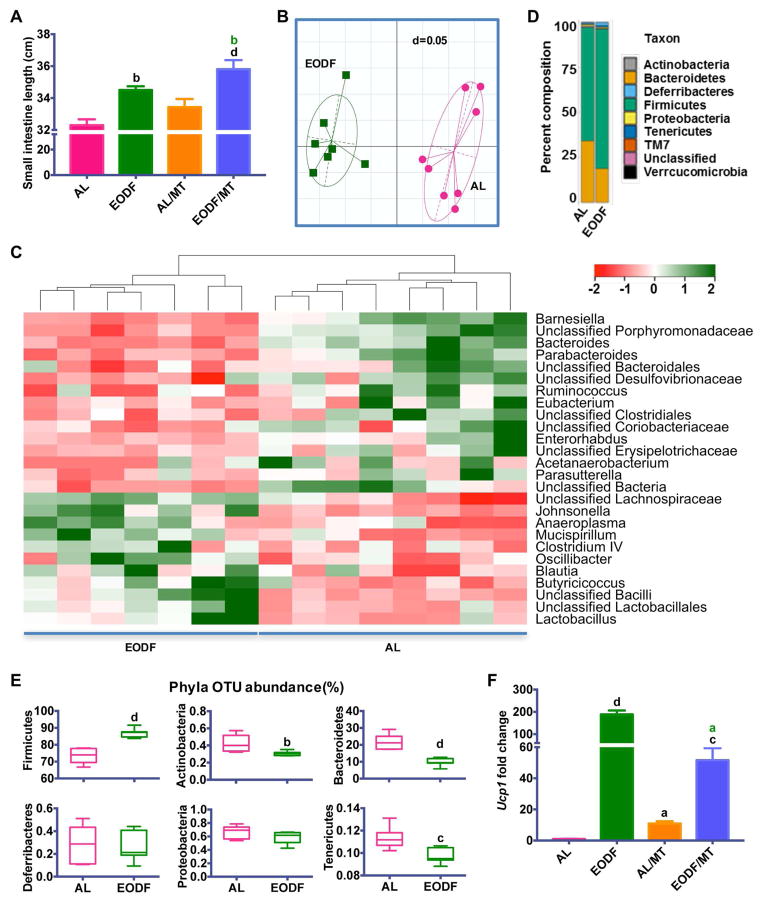
Figure 3. Gut microbiota mediates EODF induced WAT beiging.
(A) Length of small intestine of AL mice, EODF mice, mice transplanted with AL microbiota (AL/MT), and mice transplanted with EODF microbiota (EODF/MT). n=8 mice/group.
(B) UniFrac distances of AL and EODF mice. n=7–8 mice/group.
(C) Z-scores for genera between AL and EODF mice. n=7–8 mice/group.
(D) Hierarchical clustering diagram comparing ceca of AL and EODF mice. n=7–8 mice/group.
(E) Representative Phyla Operational Taxonomic Unit (OTU) abundance (%) of ceca of AL and EODF mice. n=7–8 mice/group.
(F) Ucp1 mRNA expression in inguinal WAT in the fed state. n= 8 mice/group.
Data are presented as mean ± SEM. Different lowercase letters indicate different statistical significance by two-tailed unpaired t-test (E) or one-way ANOVA with Bonferroni posttest (A, F), a, p < 0.05; b, p < 0.01; c, p < 0.005; and d, p < 0.001. Black letters versus AL, and green letters versus AL/MT.
See also Figure S6.

