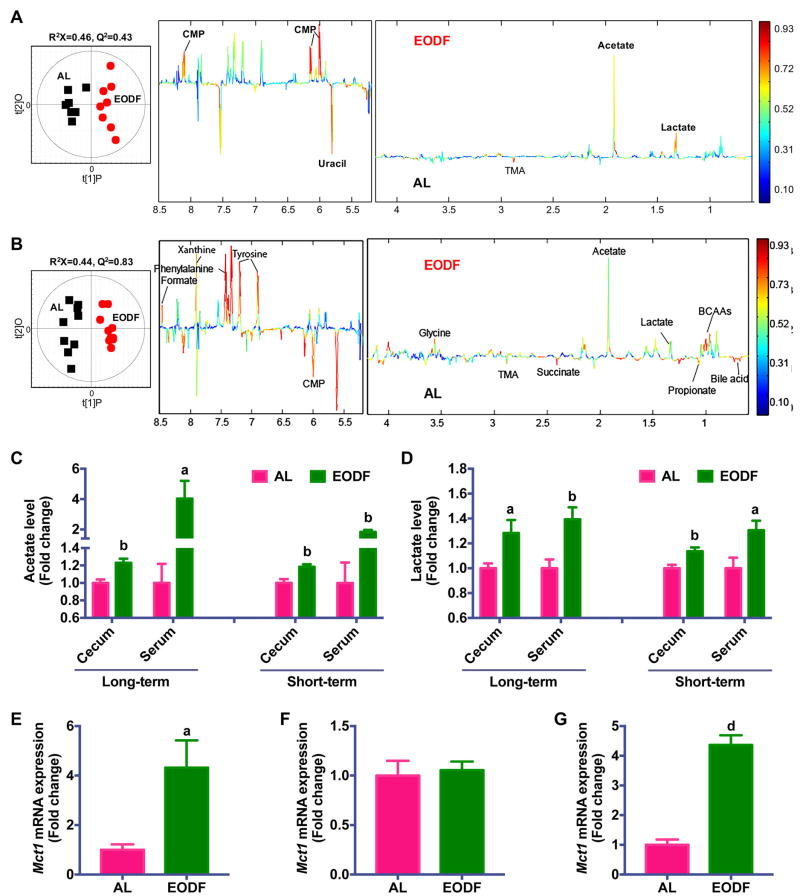
Figure 4. Microbiota metabolites underlie the mechanism of EODF-induced beiging.
(A) Orthogonal projection to latent structure-discriminant analysis (OPLS-DA) scores (left) and correlation coefficient-coded loadings plots for the models (right) from NMR spectra of cecal content aqueous extracts from mice after long-term EODF treatment. n= 7–8 mice/group.
(B) OPLS-DA scores (left) and correlation coefficient-coded loadings plots for the models (right) from NMR spectra of cecal content aqueous extracts from mice after short-term EODF treatment. n= 10 mice/group.
(C–D) Cecum and serum acetate (C) and lactate (D) levels from mice after long-term and short-term EODF treatment. n= 7–10 mice/group.
(E, F) mRNA expression of Mct1 in inguinal WAT (E) and BAT (F) from mice after long-term EODF treatment in the fed state. n= 7–8 mice/group.
(G) mRNA expression of Mct1 in inguinal WAT from mice after short-term EODF treatment in the fed state. n= 10 mice/group.
Data are presented as mean ± SEM. Different lowercase letters indicate statistical significance by two-tailed unpaired t-test, a, p < 0.05; b, p < 0.01; and d, p < 0.001 versus AL.
See also Figure S7.

