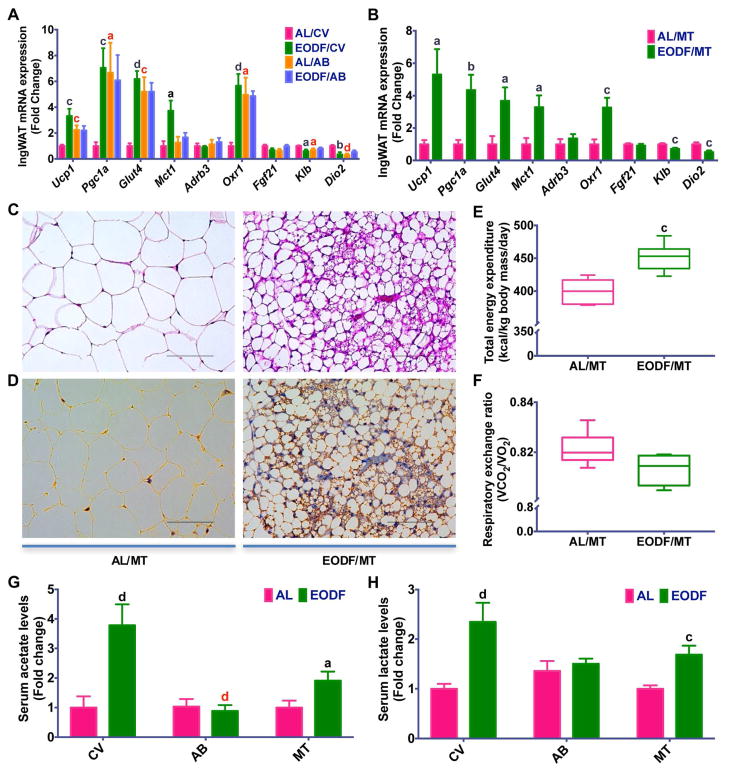
Figure 7. Gut microbiota mediates the effects of EODF on inguinal WAT beiging in DIO mice.
(A, B) mRNA expression of thermogenic genes in inguinal WAT in the fed state. All mice were given access to control vehicle (CV) water or water supplemented with an antibiotics cocktail (AB) for 4 weeks, and then treated with AL or EODF (A) or microbiota transplantation (MT, B). n=6–8 mice/group.
(C) Representative H & E staining of inguinal WAT from mice transplanted with EODF microbiota (EODF/MT, right) and AL microbiota (AL/MT, left). Scale bar: 100 μm.
(D) Representative UCP1 immunohistochemical staining of inguinal WAT sections from EODF/MT (right) and AL/MT (left) mice. Scale bar: 100 μm.
(E, F) Daily total energy expenditure (E) and respiratory exchange ratio (F) of AL/MT and EODF/MT mice. n=6 mice/group.
(G, H) Serum acetate (G) and lactate (H) of DIO mice after EODF or MT treatment. Before EODF or MT treatment, all mice were given access to CV or AB water for 4 weeks. n=6–8 mice/group.
Data are presented as mean ± SEM. Different lowercase letters indicate statistical significance by two-way ANOVA with Sidak multiple comparisons (A) or two-tailed unpaired t-test (B, E–H), a, p < 0.05; c, p < 0.005; and d, p < 0.001. Black letters show the effects of EODF or EODF/MT (EODF versus AL, or EODF/MT versus AL/MT drunk with the same water), red letters the effects of microbiota depletion (AB versus CV within the same feeding regimen).

