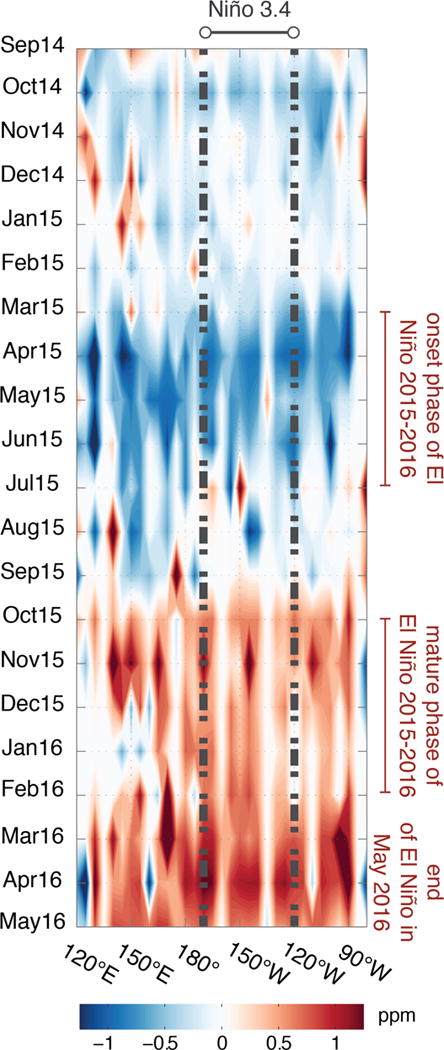
Fig. 5.

Time evolution of the XCO2 anomalies (ppm) averaged over 5°S–5°N. The x-axis represents longitude and the y-axis shows the time progressing from top to bottom in months. The 2015–2016 El Niño event and its onset and mature phases are highlighted to show the distinct responses observed over the tropical Pacific Ocean. The grey dashed lines capture the boundaries of the Niño 3.4 region. During the onset phase (i.e., March – July 2015), perceptible gradients are observable from the far western Pacific to the central Pacific (consistent with the increasing flux from west to east) along with high variability in the XCO2 anomalies in the central Pacific. We also notice that the XCO2 anomalies are smaller over the eastern Pacific, which is consistent with surface seawater pCO2 data collected on the TAO buoys (92). The transition from the ocean to the terrestrial signal happens between July and October 2015. Towards the latter stages of the El Niño event (i.e., November 2015 and later), the terrestrial signal dominates the observed trends in XCO2 likely masking any underlying ocean signal.
