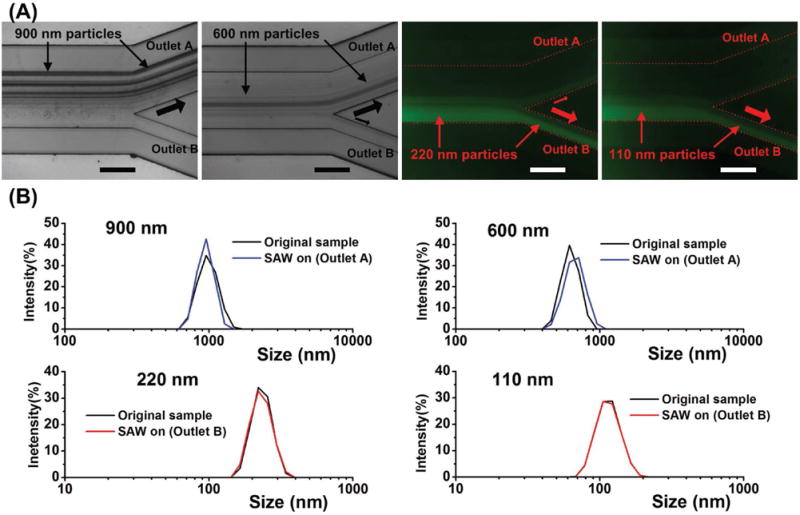
Figure 3.

The taSSAW acoustic field functions as a size-based filter. A) Images at the outlet region show that 900 and 600 nm particles were pushed to outlet A, while 220 and 110 nm particles remain on the path to outlet B. B) Characterization of postfiltration samples from outlet A for 900 and 600 nm particles and from outlet B for 220 and 110 nm particles. The size distribution curve was obtained with a Malvern Zetasizer. The y axis is the intensity of signals measured by dynamic light scattering (DLS).
