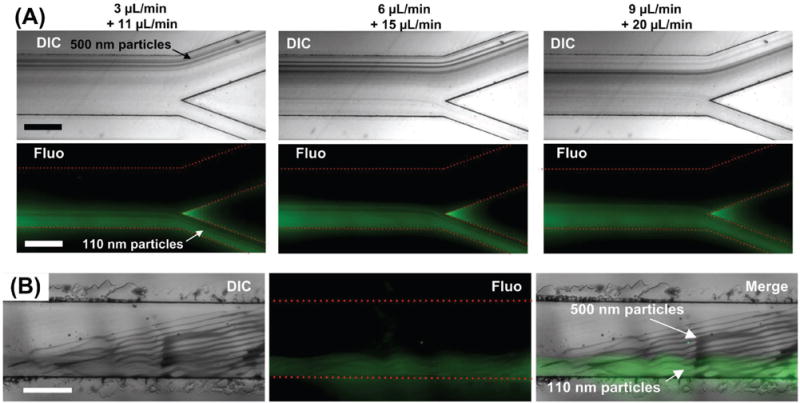
Figure 5.

Acoustic separation of 500 and 110 nm particles. A) The separation maintained high efficiency as the throughput increased. 3 + 11 μL min−1: the flow rates of the sample and the sheath flow were 3 and 11 μL min−1, respectively. B) Bright-field and fluorescent images at the acoustic active region. The flow rates of the sample and the sheath flow were 4 and 12 μL min−1, respectively. Scale bar: 500 μm.
