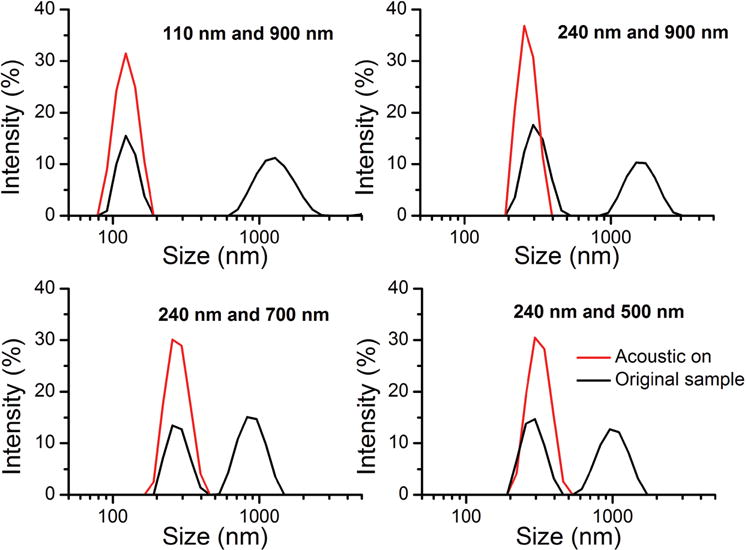
Figure 7.

The size distributions of samples before (black lines) and after (red lines) acoustic separation. Samples were tested with the Malvern Zetasizer, which employs digital light scattering (DLS). The ordinate represents the signal intensity, and the abscissa is size distribution. The acoustic-based nanoparticle separation technique filters larger nanoparticles and yields a purified sample, which exhibited only one peak in size distribution.
